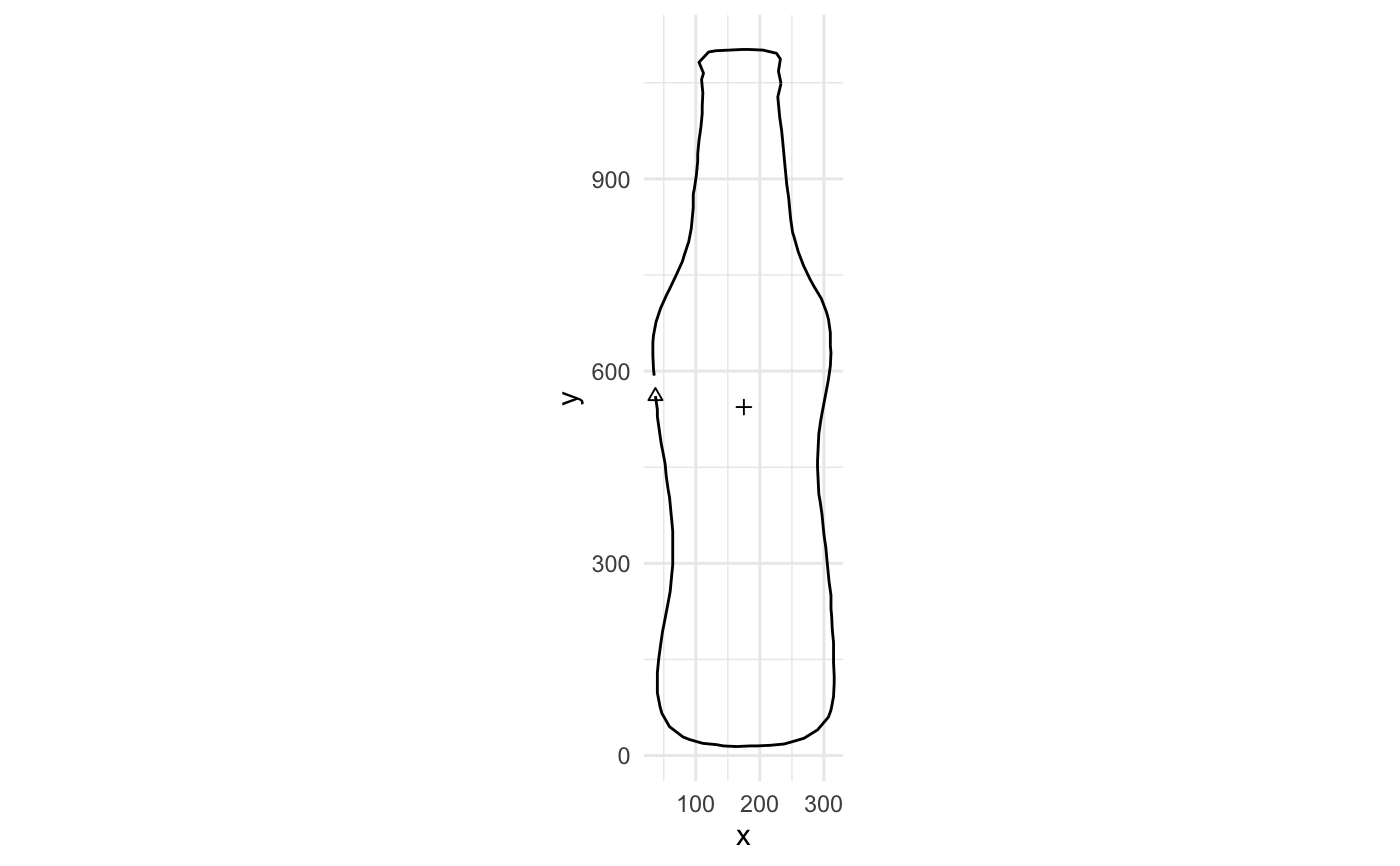
Add shapes on top of another plot
draw.RdAdd shapes on top of another plot
draw(x, gg, ...)
Arguments
| x | a Momocs object |
|---|---|
| gg |
|
| ... | additional parameters to feed geoms |
Value
a ggplot object
Examples
#>
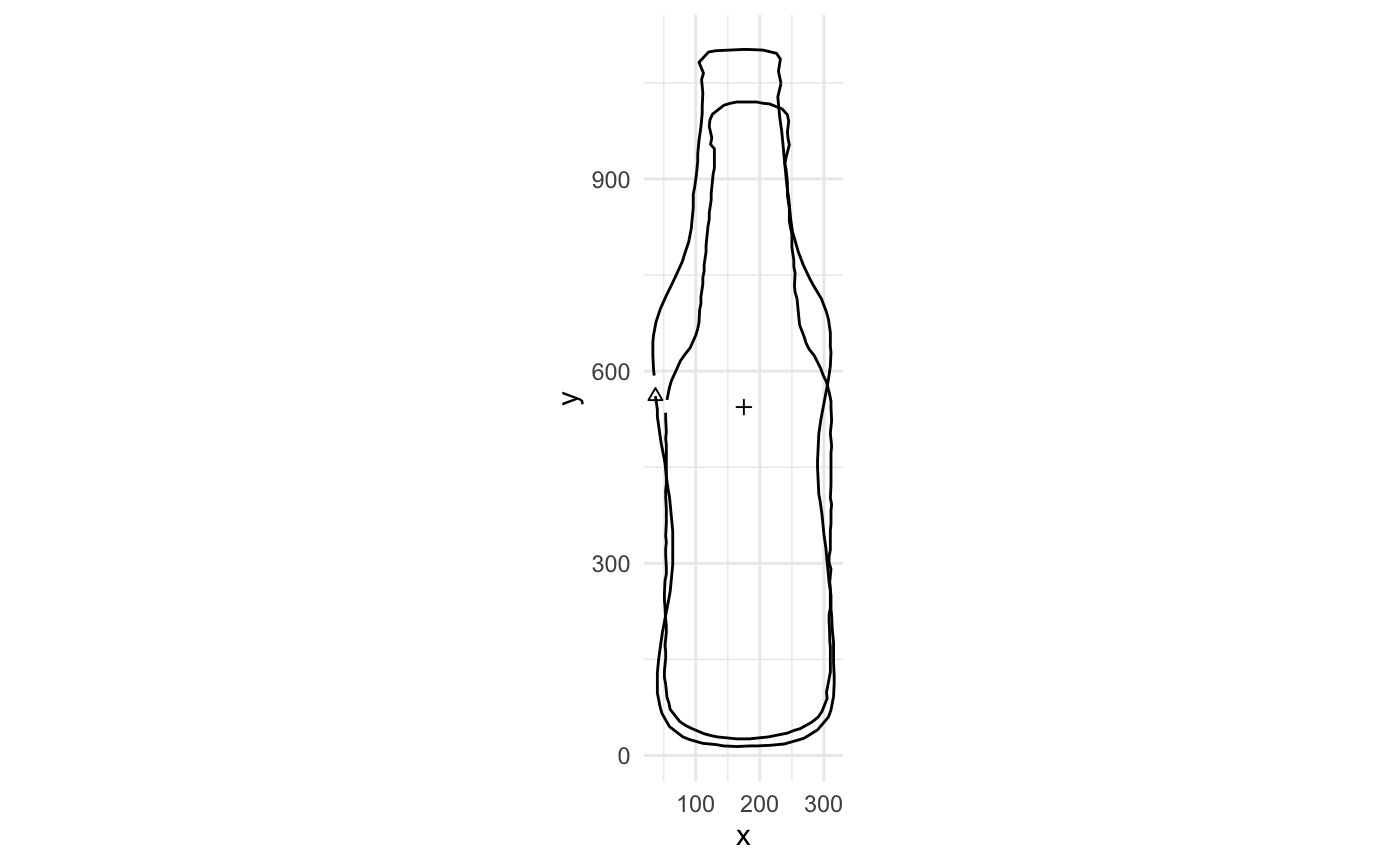
draw.RdAdd shapes on top of another plot
draw(x, gg, ...)
| x | a Momocs object |
|---|---|
| gg |
|
| ... | additional parameters to feed geoms |
a ggplot object
#>