Universal graphics functions
gg.RdDefault (ggplot2) visualisations for Momocs objects.
gg0(x, ...)

# S3 method for default
gg0(x, ...)

# S3 method for coo_single
gg0(x, ...)

# S3 method for mom_tbl
gg0(x, ...)

# S3 method for tbl
gg0(x, ...)

gg(x, first = TRUE, centroid = TRUE, axes = TRUE, ...)
Arguments
| x | a Momocs object |
|---|---|
| ... | additional parameters to feed geoms |
| first |
|
| centroid |
|
| axes |
|
| gg |
|
Value
a ggplot object
Details
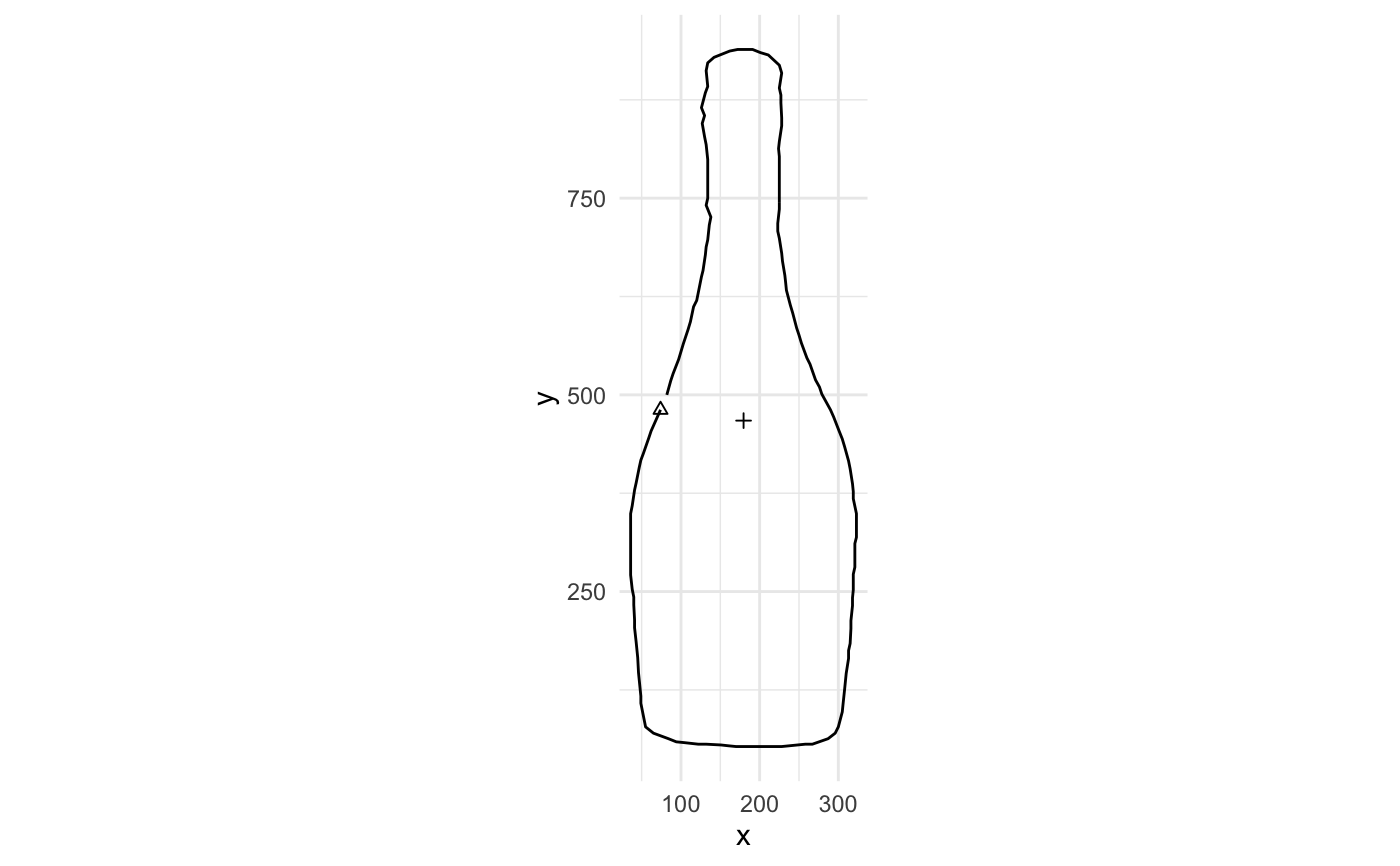
gg is the base plotter.
gg0 prepare the canvas but let you pick your ggplot2::geoms.
draw add shapes on top of last plot
Note
I call it "universal" as a reminder to provide a gg for each object.
Examples
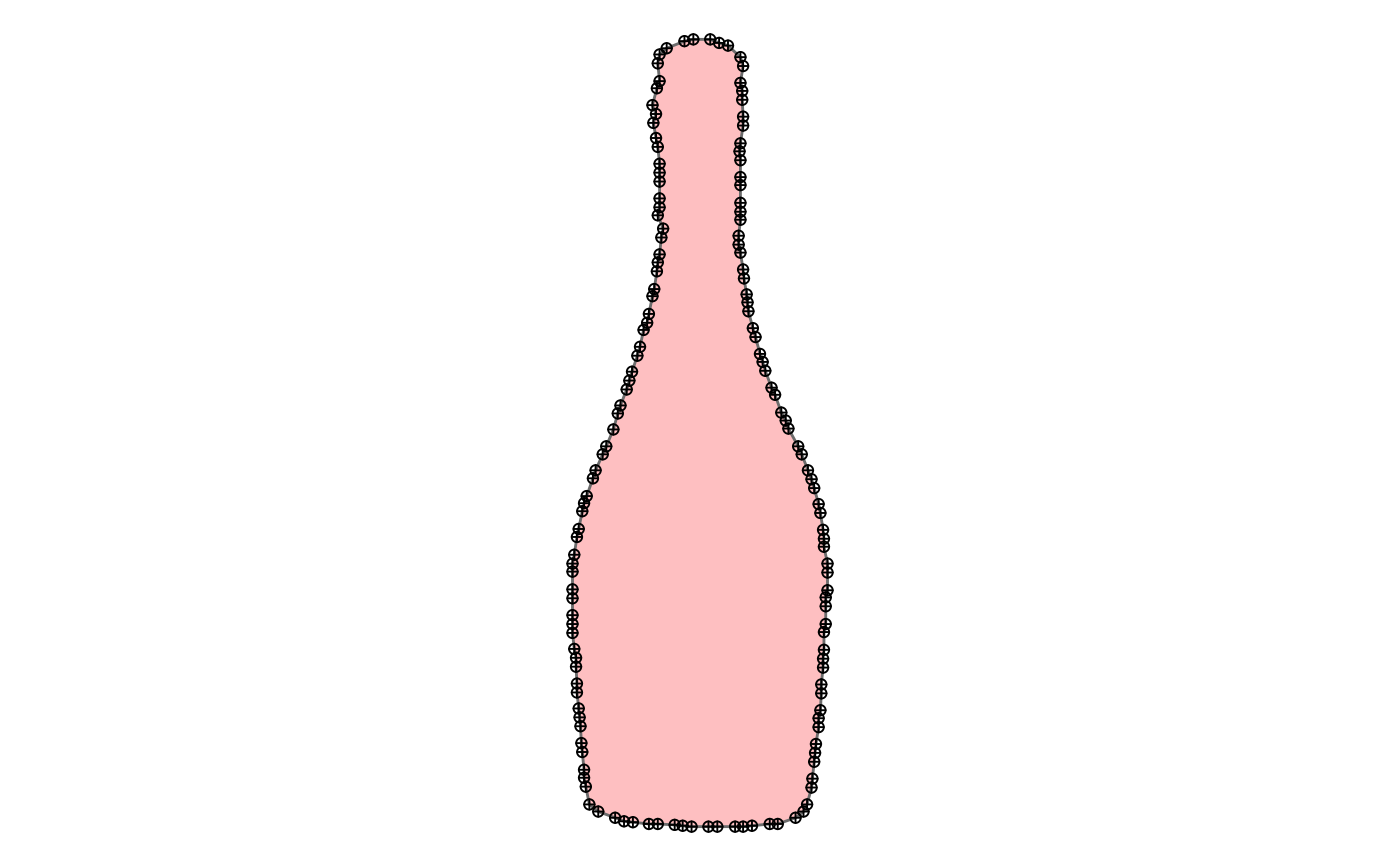
# Let's add some geoms to nice_plot <- gg0(b) + ggplot2::geom_polygon(color="grey50", fill="red", alpha=0.25) + ggplot2::geom_point(shape="circle plus") nice_plot # print it# you have all ggplot2 for free 8-) # you do not have to ggplot2:: if you library(ggplot2) before gorgeous_plot <- nice_plot + ggplot2::theme_minimal() + ggplot2::labs(x="abscissa", y="ordinate", title="Drink responsibly") # this is a plotting factory ! # gorgeous_plot %+% pick(bot, 12)