Display one or more shapes stacked on the same plot.
Arguments
- x
A matrix (nx2), list of matrices, or tibble with coo columns.
- ...
Additional arguments passed to plotting functions.
- .cols
Column name(s) to process when
xis a tibble. IfNULL, automatically detects columns containing coo objects.- .ldk_col
Character. Name of landmark column. If
NULL, usescolname_ldk.
Details
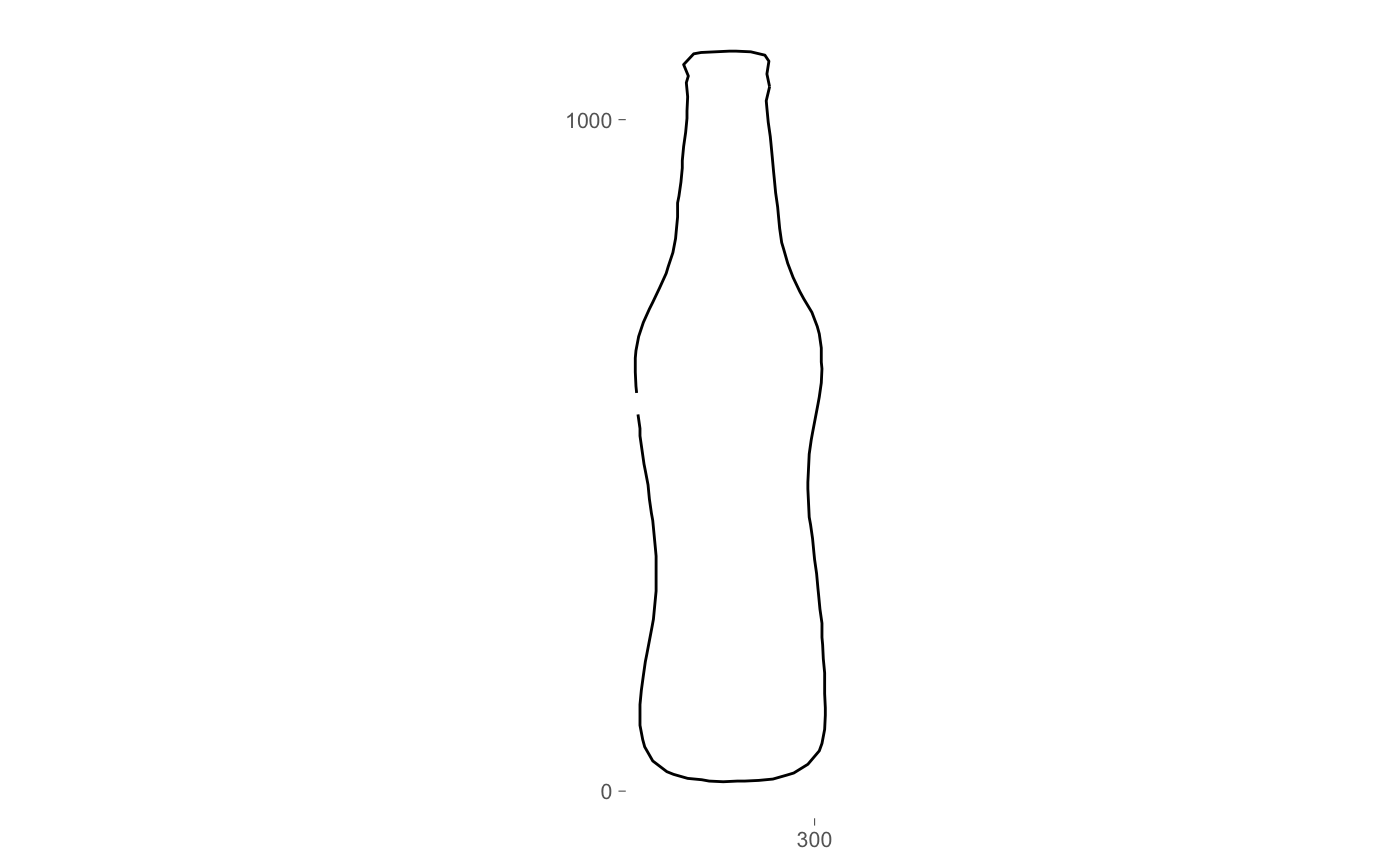
Stacks all shapes on a single plot. Works with:
Single matrix: plots that shape
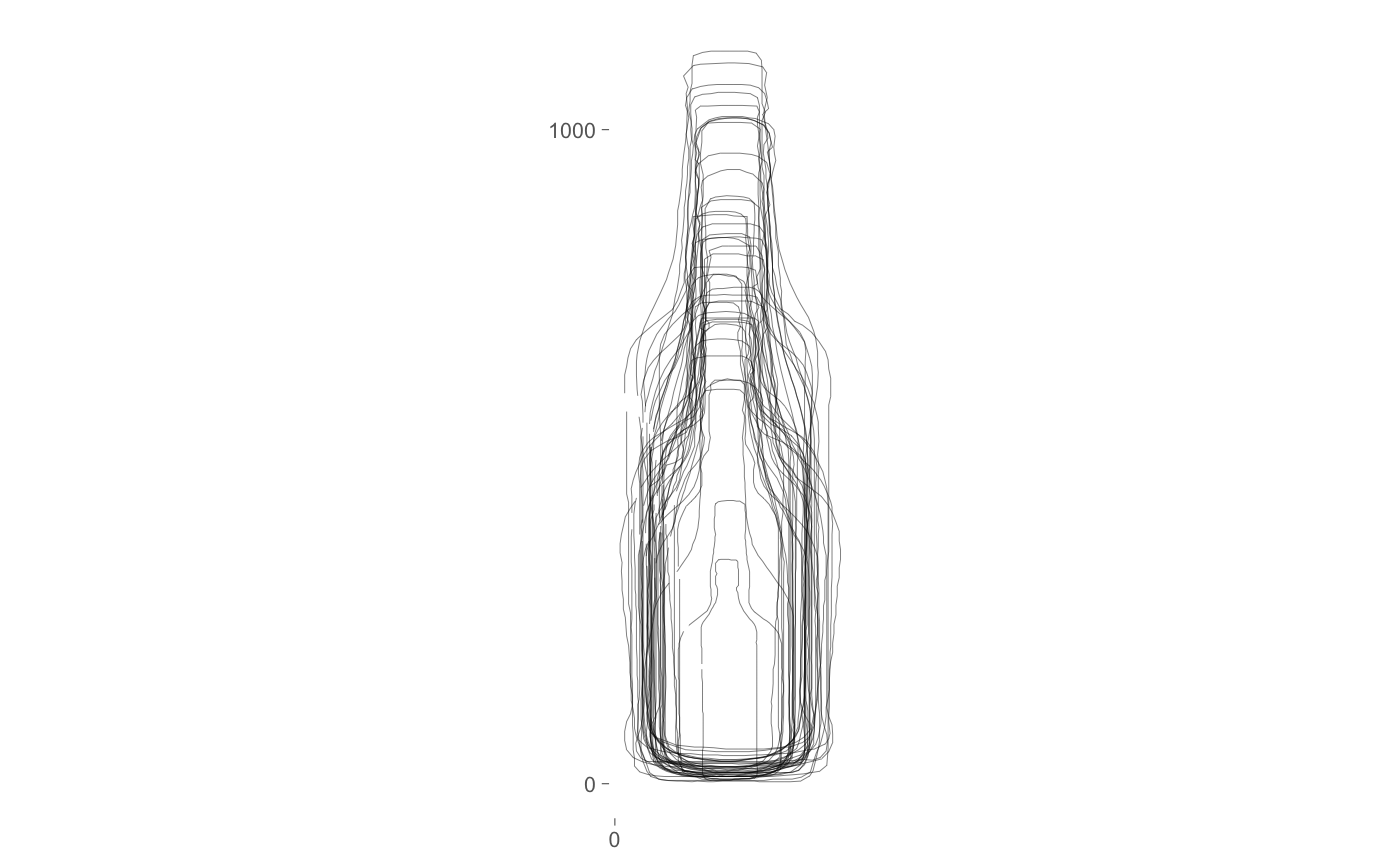
List of matrices: plots all shapes overlaid
Tibble: plots all shapes from coo column (or specified
.cols)
If a tibble has a landmark column (e.g., coo_ldk), landmarks will be drawn
in addition to outlines. Otherwise, falls back to heuristic: if shapes have
fewer than 32 points, draws as landmarks; otherwise draws as outlines.