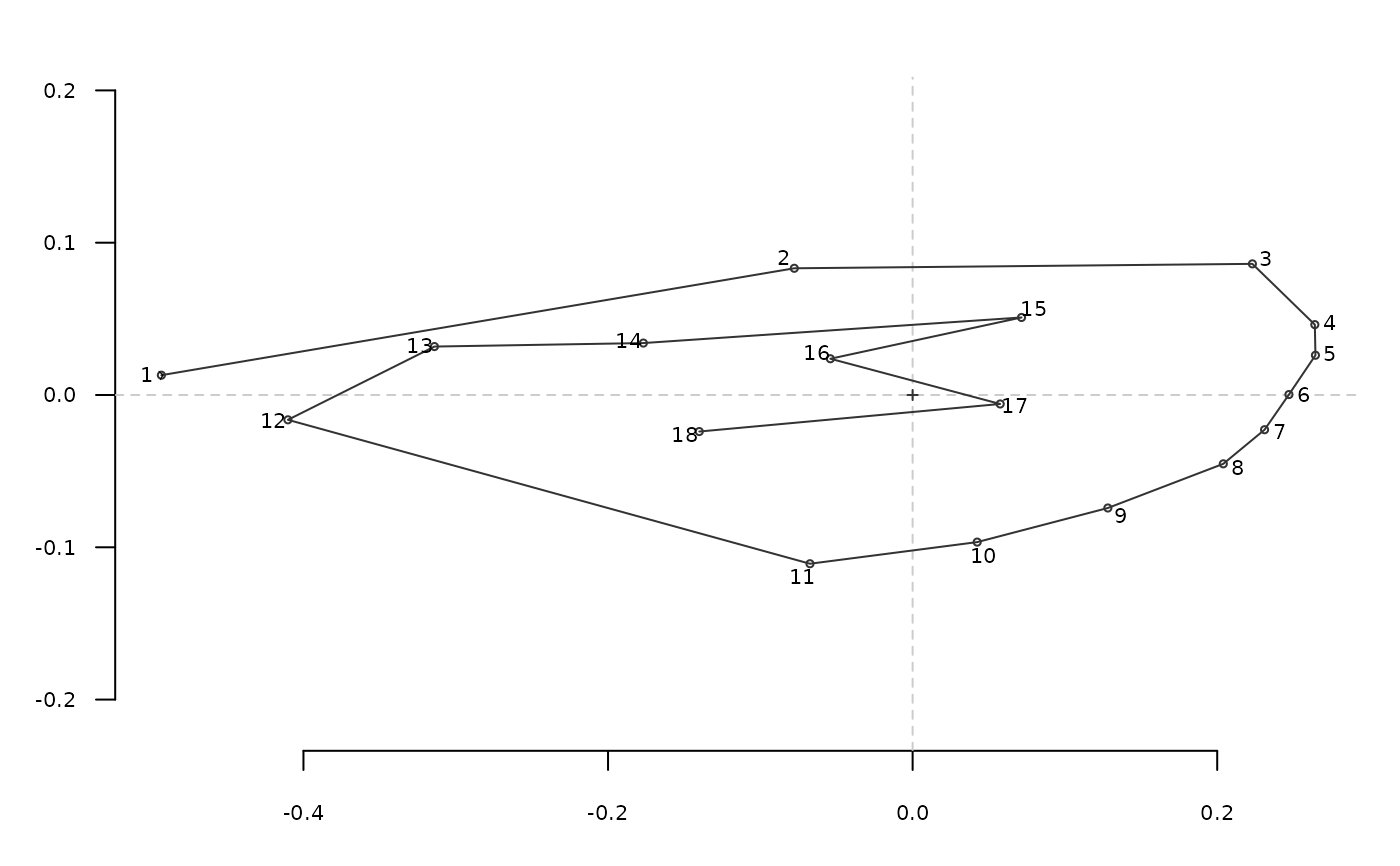
Add landmarks labels
Arguments
- ldk
a matrix of (x; y) coordinates: where to plot the labels
- d
how far from the coordinates, on a (centroid-landmark) segment
- cex
the cex for the label
- ...
additional parameters to fed text
See also
Other plotting functions:
coo_arrows(),
coo_draw(),
coo_listpanel(),
coo_lolli(),
coo_plot(),
coo_ruban(),
ldk_chull(),
ldk_confell(),
ldk_contour(),
ldk_links(),
plot_devsegments(),
plot_table()
Other ldk plotters:
ldk_chull(),
ldk_confell(),
ldk_contour(),
ldk_links()