coo_draw is simply a coo_plot with plot.new=FALSE, ie
that adds a shape on the active plot.
Arguments
- coo
a
listor amatrixof coordinates.- ...
optional parameters for coo_plot
See also
Other plotting functions:
coo_arrows(),
coo_listpanel(),
coo_lolli(),
coo_plot(),
coo_ruban(),
ldk_chull(),
ldk_confell(),
ldk_contour(),
ldk_labels(),
ldk_links(),
plot_devsegments(),
plot_table()
Examples
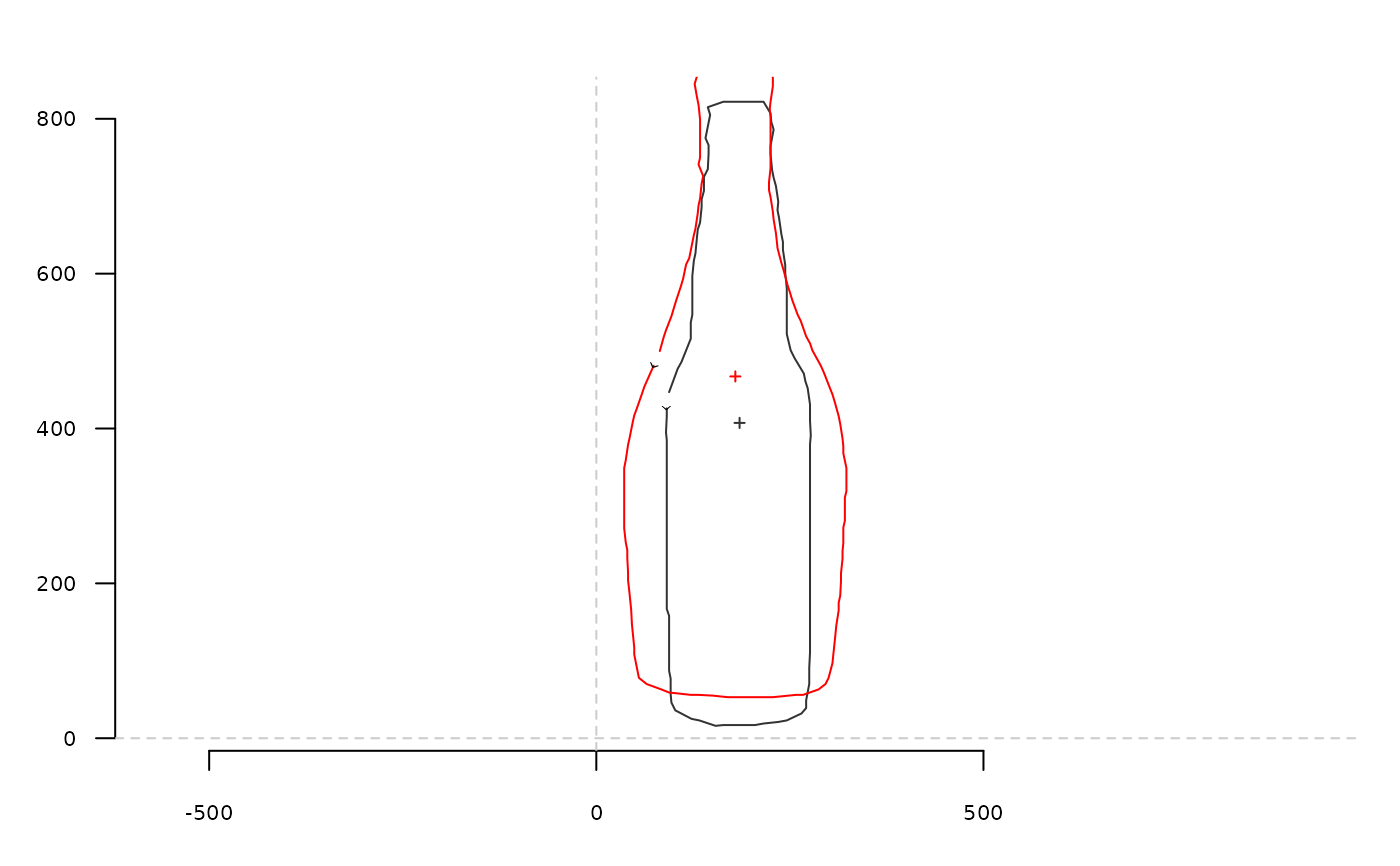
b1 <- bot[4]
b2 <- bot[5]
coo_plot(b1)
coo_draw(b2, border='red') # all coo_plot arguments will work for coo_draw