Plots (lollipop) differences between two configurations
Source:R/gr-domesticplotters.R
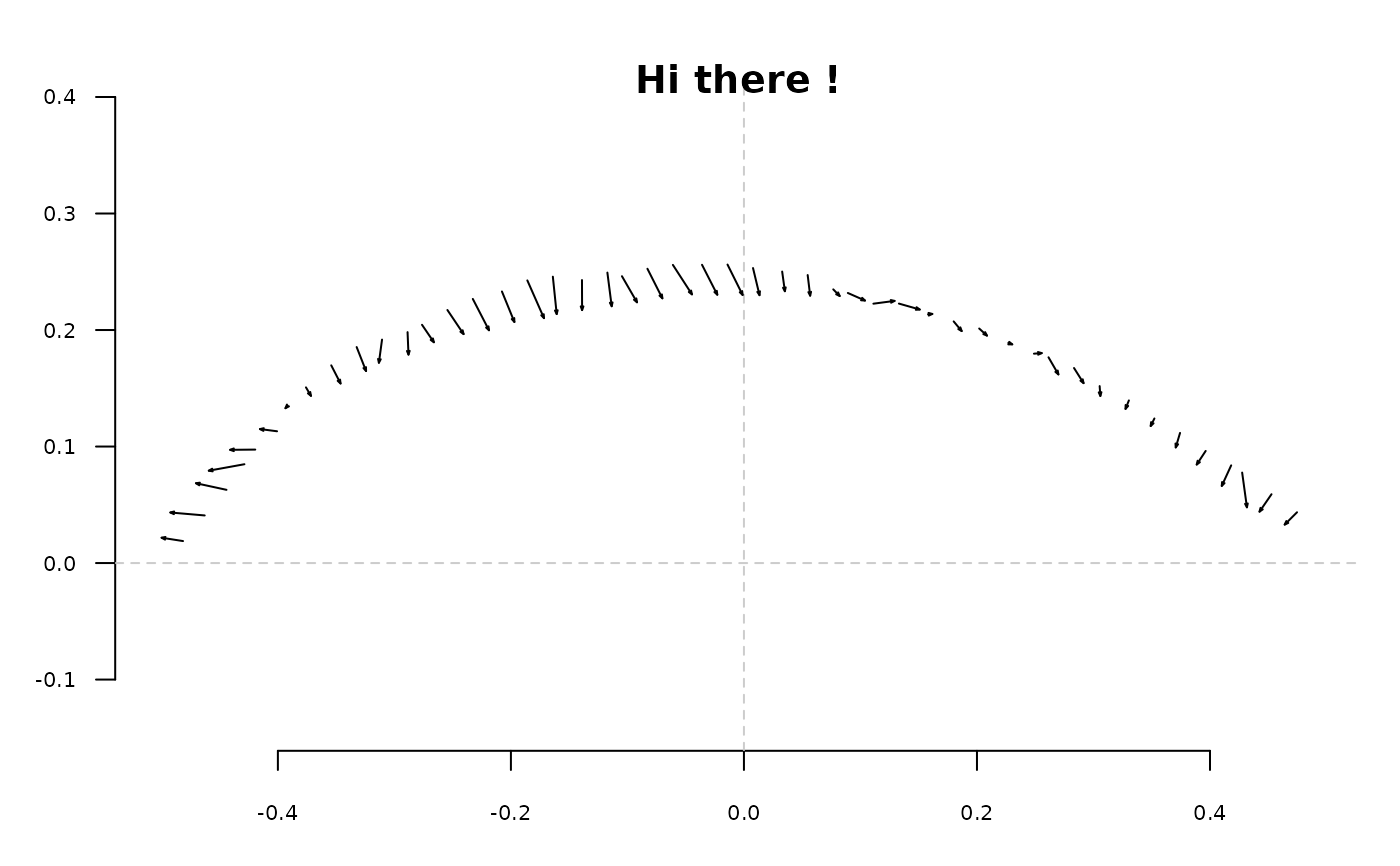
coo_arrows.RdDraws 'arrows' between two configurations.
Usage
coo_arrows(coo1, coo2, length = coo_centsize(coo1)/15, angle = 20, ...)Arguments
- coo1
A
listor amatrixof coordinates.- coo2
A
listor amatrixof coordinates.- length
a length for the arrows.
- angle
an angle for the arrows
- ...
optional parameters to fed arrows.
See also
Other plotting functions:
coo_draw(),
coo_listpanel(),
coo_lolli(),
coo_plot(),
coo_ruban(),
ldk_chull(),
ldk_confell(),
ldk_contour(),
ldk_labels(),
ldk_links(),
plot_devsegments(),
plot_table()
Examples
coo_arrows(coo_sample(olea[3], 50), coo_sample(olea[6], 50))
#> Warning: zero-length arrow is of indeterminate angle and so skipped
title("Hi there !")