Details
May be long, so you can estimate it on a sample either with id here, or one of sample_n or sample_frac
See also
Other calibration:
calibrate_deviations(),
calibrate_harmonicpower(),
calibrate_reconstructions
Examples
olea %>% slice(1:5) %>% #for the sake of spped
calibrate_r2_opoly(degree.range=1:5, thresh=c(0.9, 0.99))
 #> $gg
 #>
#> $q
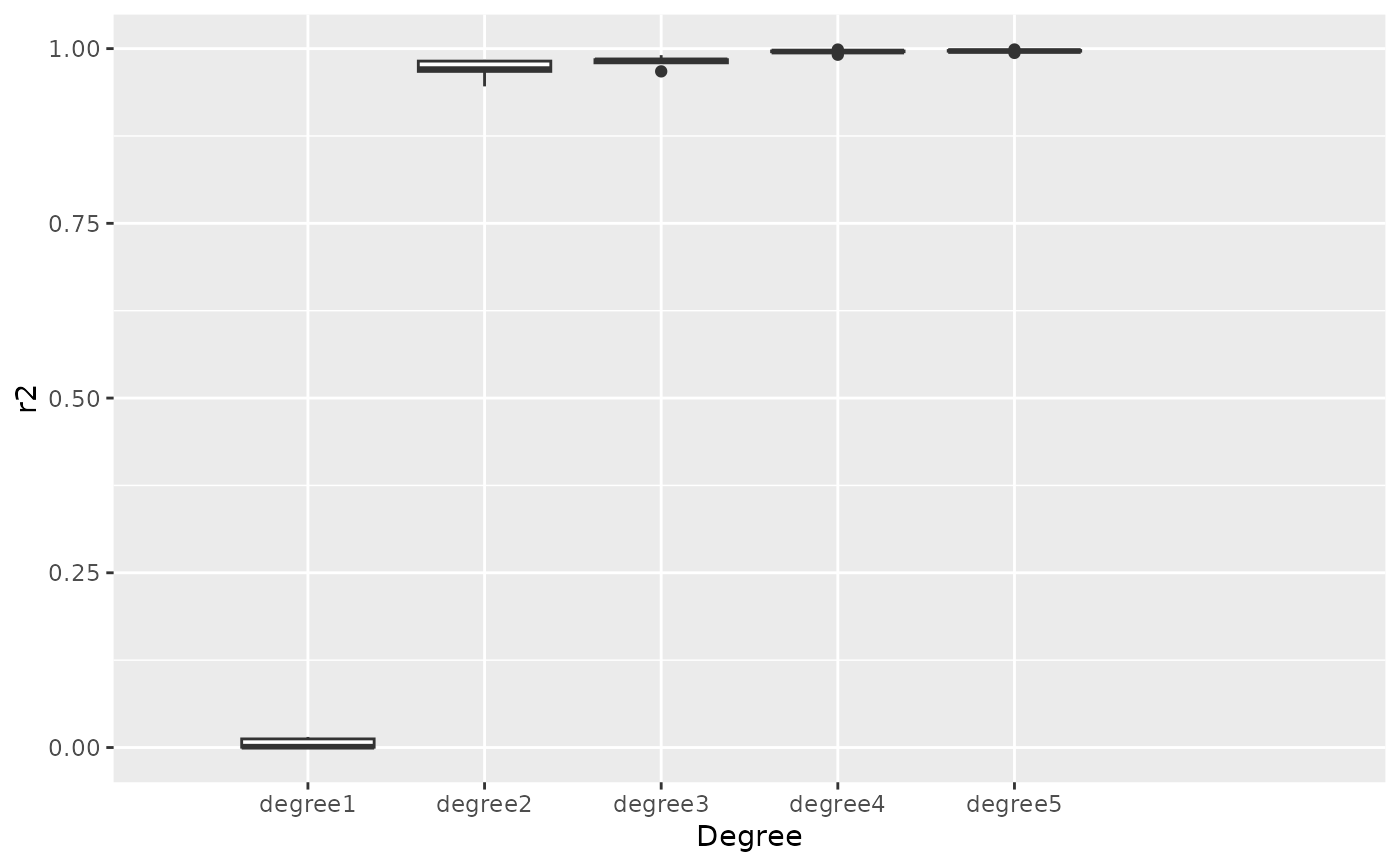
#> degree1 degree2 degree3 degree4 degree5
#> 0001-cAglan_O10VD 0.0004287127 0.9821251 0.9831469 0.9986415 0.9987220
#> 0001-cAglan_O10VL 0.0011742448 0.9838978 0.9841793 0.9955520 0.9972836
#> 0001-cAglan_O11VD 0.0123113197 0.9706618 0.9906431 0.9965470 0.9965690
#> 0001-cAglan_O11VL 0.0151312838 0.9459654 0.9796698 0.9958102 0.9963290
#> 0001-cAglan_O12VD 0.0002310795 0.9673982 0.9674270 0.9912600 0.9938820
#>
#> $mind
#> 0.9 0.99
#> 2 4
#>
olea %>% slice(1:5) %>% #for the sake of spped
calibrate_r2_npoly(degree.range=1:5, thresh=c(0.9, 0.99))
#>
#> $q
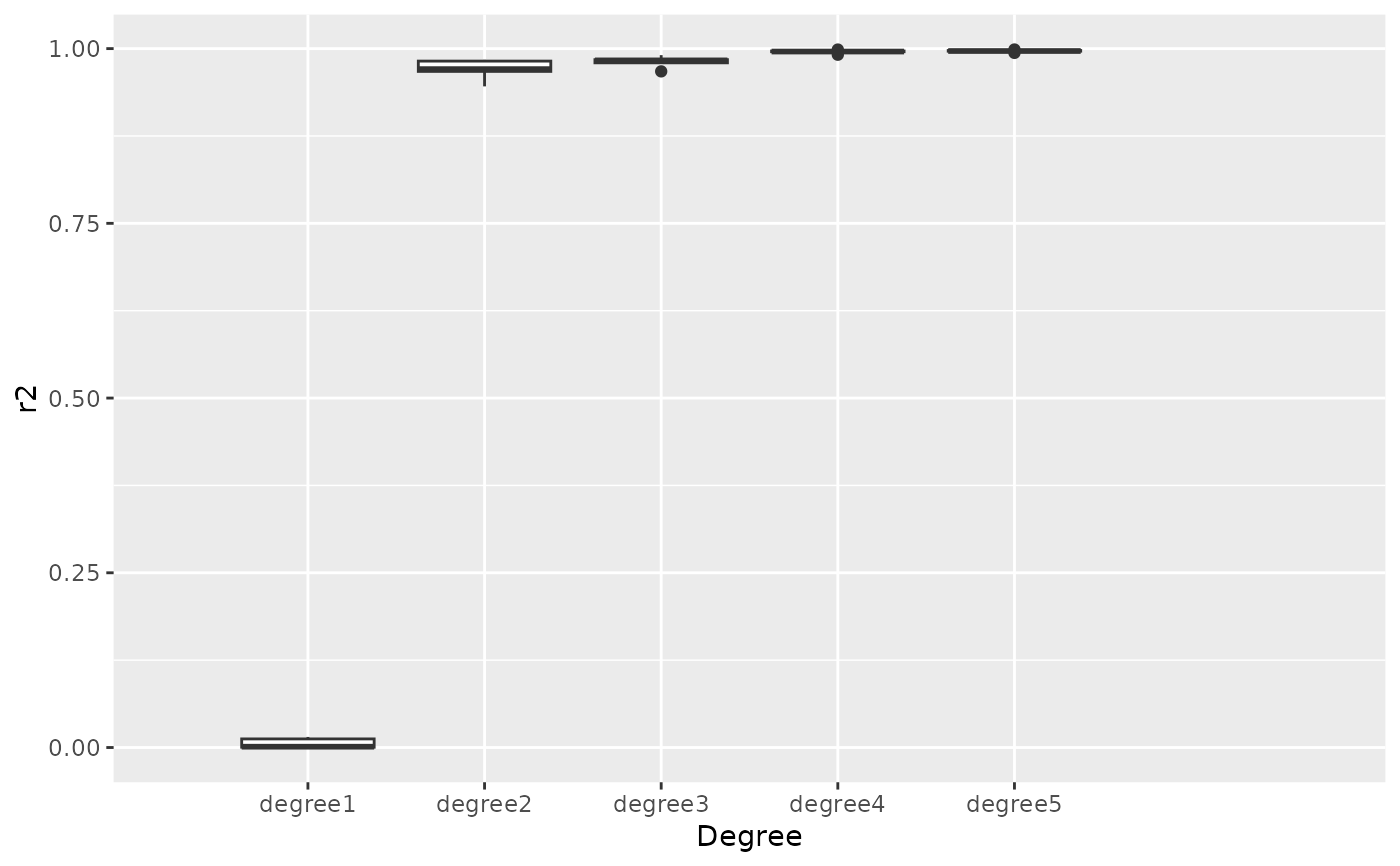
#> degree1 degree2 degree3 degree4 degree5
#> 0001-cAglan_O10VD 0.0004287127 0.9821251 0.9831469 0.9986415 0.9987220
#> 0001-cAglan_O10VL 0.0011742448 0.9838978 0.9841793 0.9955520 0.9972836
#> 0001-cAglan_O11VD 0.0123113197 0.9706618 0.9906431 0.9965470 0.9965690
#> 0001-cAglan_O11VL 0.0151312838 0.9459654 0.9796698 0.9958102 0.9963290
#> 0001-cAglan_O12VD 0.0002310795 0.9673982 0.9674270 0.9912600 0.9938820
#>
#> $mind
#> 0.9 0.99
#> 2 4
#>
olea %>% slice(1:5) %>% #for the sake of spped
calibrate_r2_npoly(degree.range=1:5, thresh=c(0.9, 0.99))
 #> $gg
 #>
#> $q
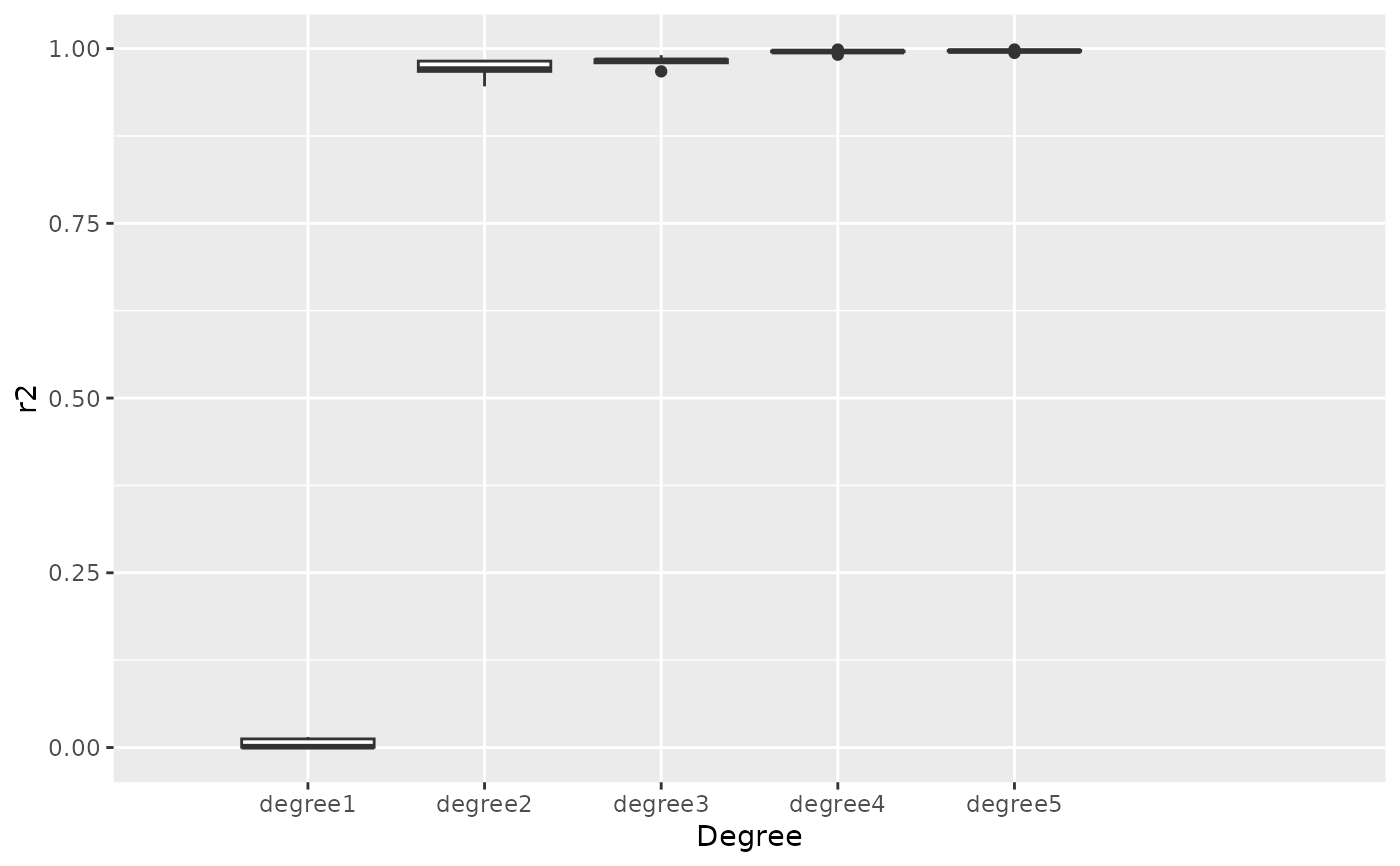
#> degree1 degree2 degree3 degree4 degree5
#> 0001-cAglan_O10VD 0.0004287127 0.9821251 0.9831469 0.9986415 0.9987220
#> 0001-cAglan_O10VL 0.0011742448 0.9838978 0.9841793 0.9955520 0.9972836
#> 0001-cAglan_O11VD 0.0123113197 0.9706618 0.9906431 0.9965470 0.9965690
#> 0001-cAglan_O11VL 0.0151312838 0.9459654 0.9796698 0.9958102 0.9963290
#> 0001-cAglan_O12VD 0.0002310795 0.9673982 0.9674270 0.9912600 0.9938820
#>
#> $mind
#> 0.9 0.99
#> 2 4
#>
#>
#> $q
#> degree1 degree2 degree3 degree4 degree5
#> 0001-cAglan_O10VD 0.0004287127 0.9821251 0.9831469 0.9986415 0.9987220
#> 0001-cAglan_O10VL 0.0011742448 0.9838978 0.9841793 0.9955520 0.9972836
#> 0001-cAglan_O11VD 0.0123113197 0.9706618 0.9906431 0.9965470 0.9965690
#> 0001-cAglan_O11VL 0.0151312838 0.9459654 0.9796698 0.9958102 0.9963290
#> 0001-cAglan_O12VD 0.0002310795 0.9673982 0.9674270 0.9912600 0.9938820
#>
#> $mind
#> 0.9 0.99
#> 2 4
#>
