tps_raw calculates deformation grids and
returns position of sampled points on it.
Arguments
- fr
the reference \((x; y)\) coordinates
- to
the target \((x; y)\) coordinates
- amp
an amplification factor of differences between
frandto- over
numericthat indicates how much the thin plate splines extends over the shapes- grid.size
numericto specify the number of grid cells on the longer axis on the outlines
Value
a list with two components: grid the xy coordinates of sampled
points along the grid; dim the dimension of the grid.
See also
Other thin plate splines:
tps2d(),
tps_arr(),
tps_grid(),
tps_iso()
Examples
# \donttest{
ms <- MSHAPES(efourier(bot, 10), "type")
#> 'norm=TRUE' is used and this may be troublesome. See ?efourier #Details
b <- ms$shp$beer
w <- ms$shp$whisky
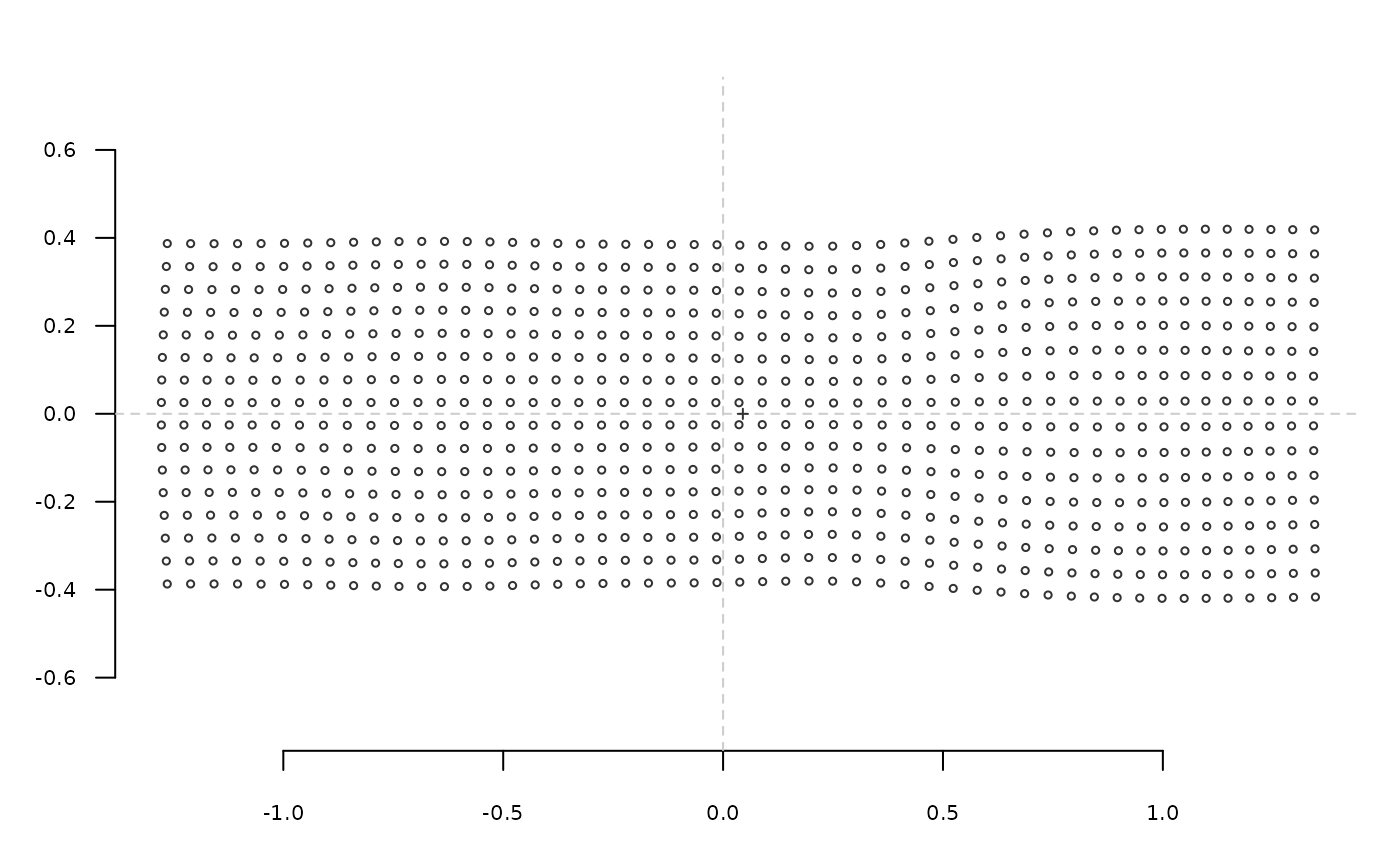
g <- tps_raw(b, w)
ldk_plot(g$grid)


# a wavy plot
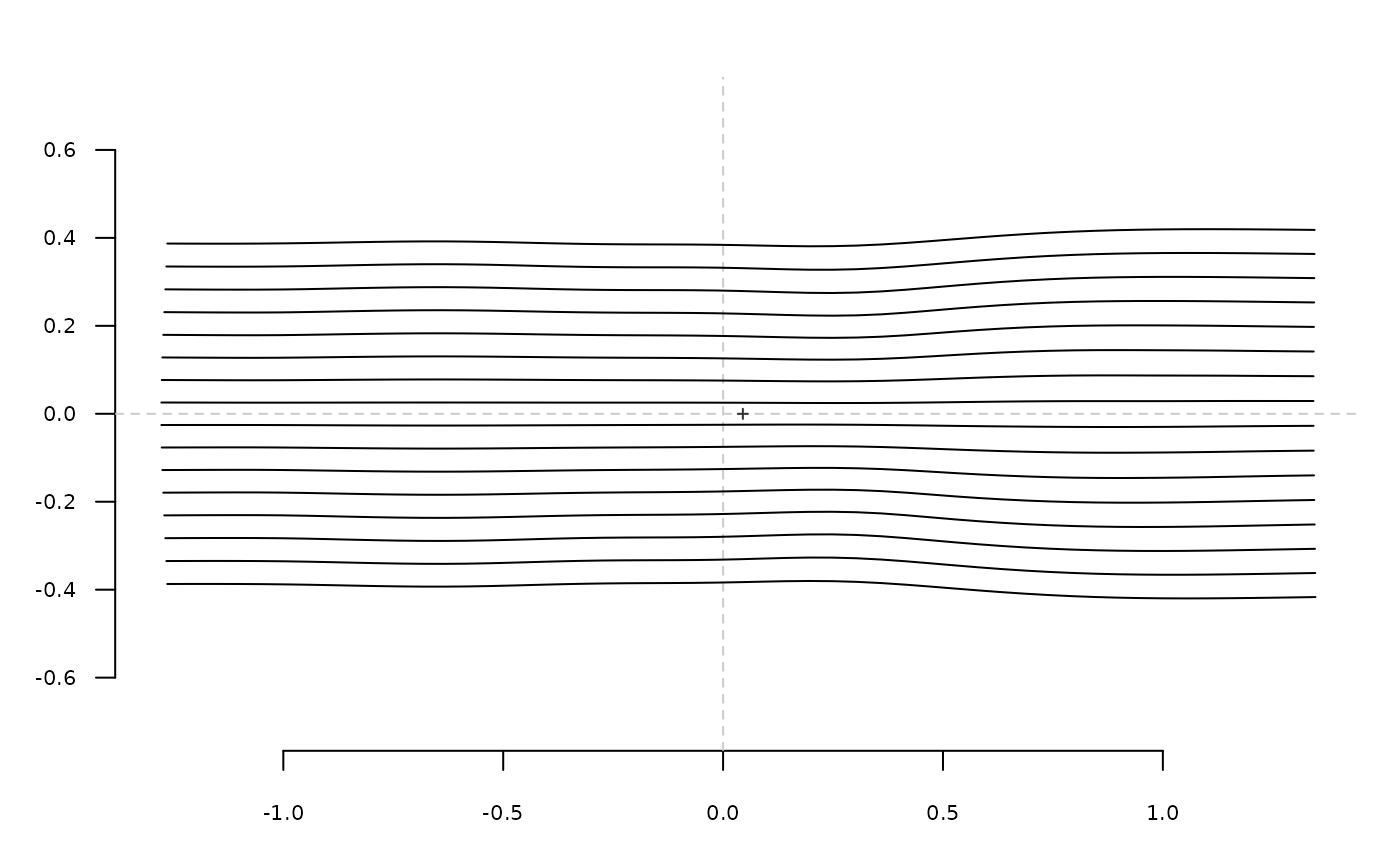
ldk_plot(g$grid, pch=NA)
cols_ids <- 1:g$dim[1]
for (i in 1:g$dim[2]) lines(g$grid[cols_ids + (i-1)*g$dim[1], ])

# }
# }
