"Confusion matrix" of a list of shapes. See examples.
Arguments
- x
a list of shapes (eg as returned by MSHAPES)
- draw_fun
one of draw_outline, draw_curves, draw_landmarks. When the result of MSHAPES is passed, detected based on
$Coe, otherwise default todraw_curves.- size
numeric shrinking factor for shapes (and coo_template; 3/4 by default)
- palette
on of palettes
Examples
x <- bot %>% efourier(6) %>% MSHAPES(~type)
#> 'norm=TRUE' is used and this may be troublesome. See ?efourier #Details
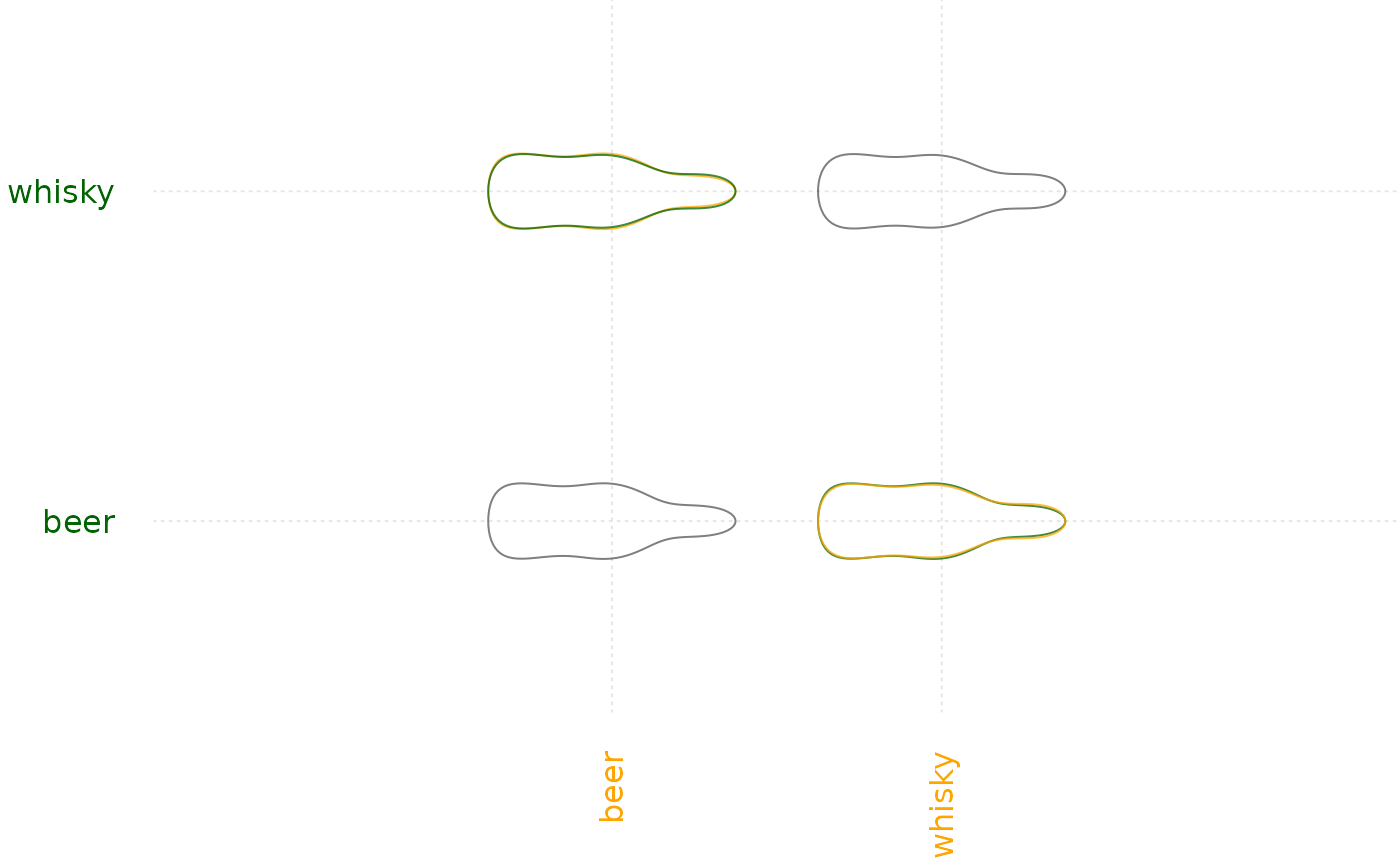
# custom colors
x %>% plot_MSHAPES(palette=pal_manual(c("darkgreen", "orange")))
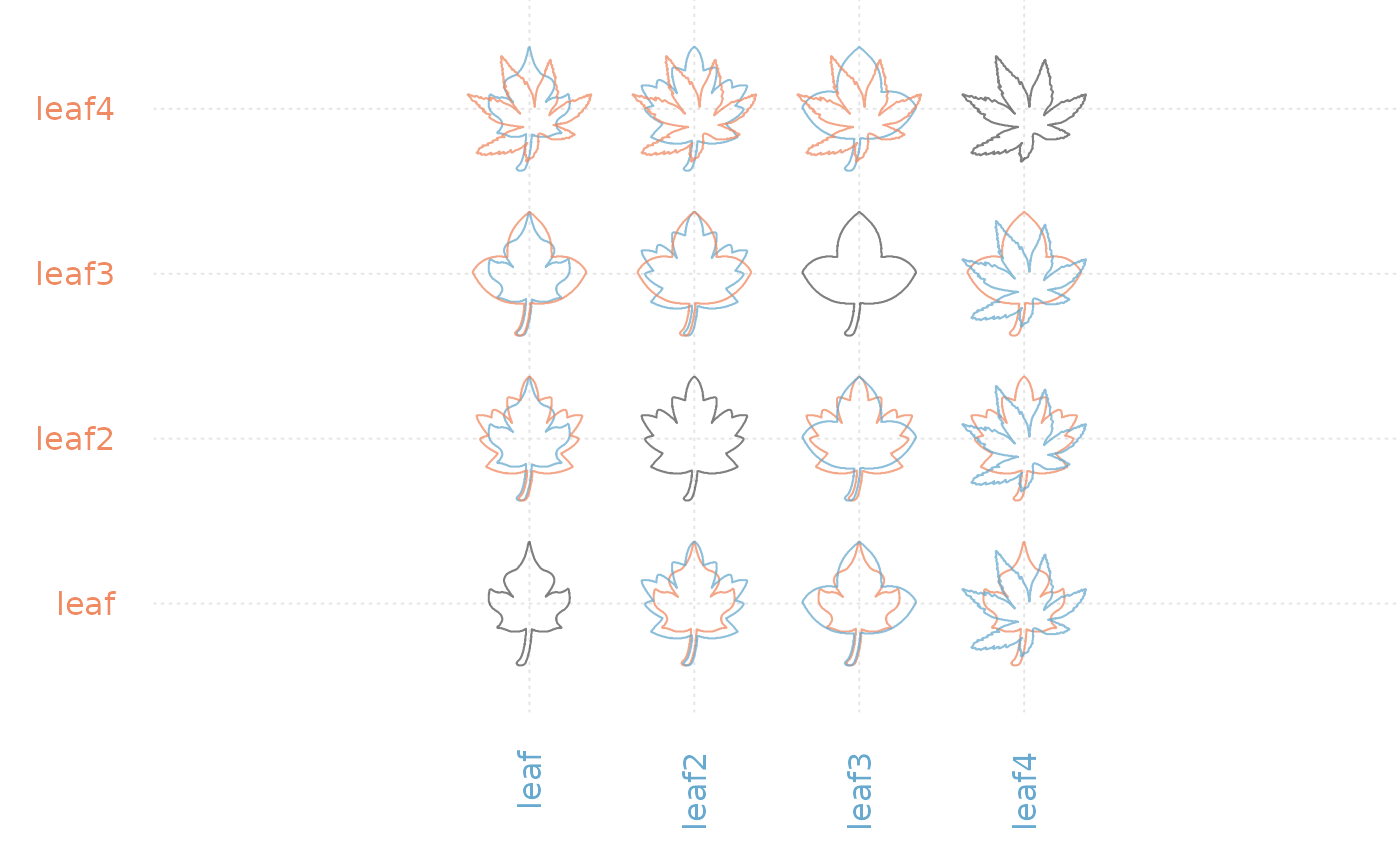
 # also works on list of shapes, eg:
leaves <- shapes %>% slice(grep("leaf", names(shapes))) %$% coo
class(leaves)
#> [1] "list"
leaves %>% plot_MSHAPES()
# also works on list of shapes, eg:
leaves <- shapes %>% slice(grep("leaf", names(shapes))) %$% coo
class(leaves)
#> [1] "list"
leaves %>% plot_MSHAPES()
 # or
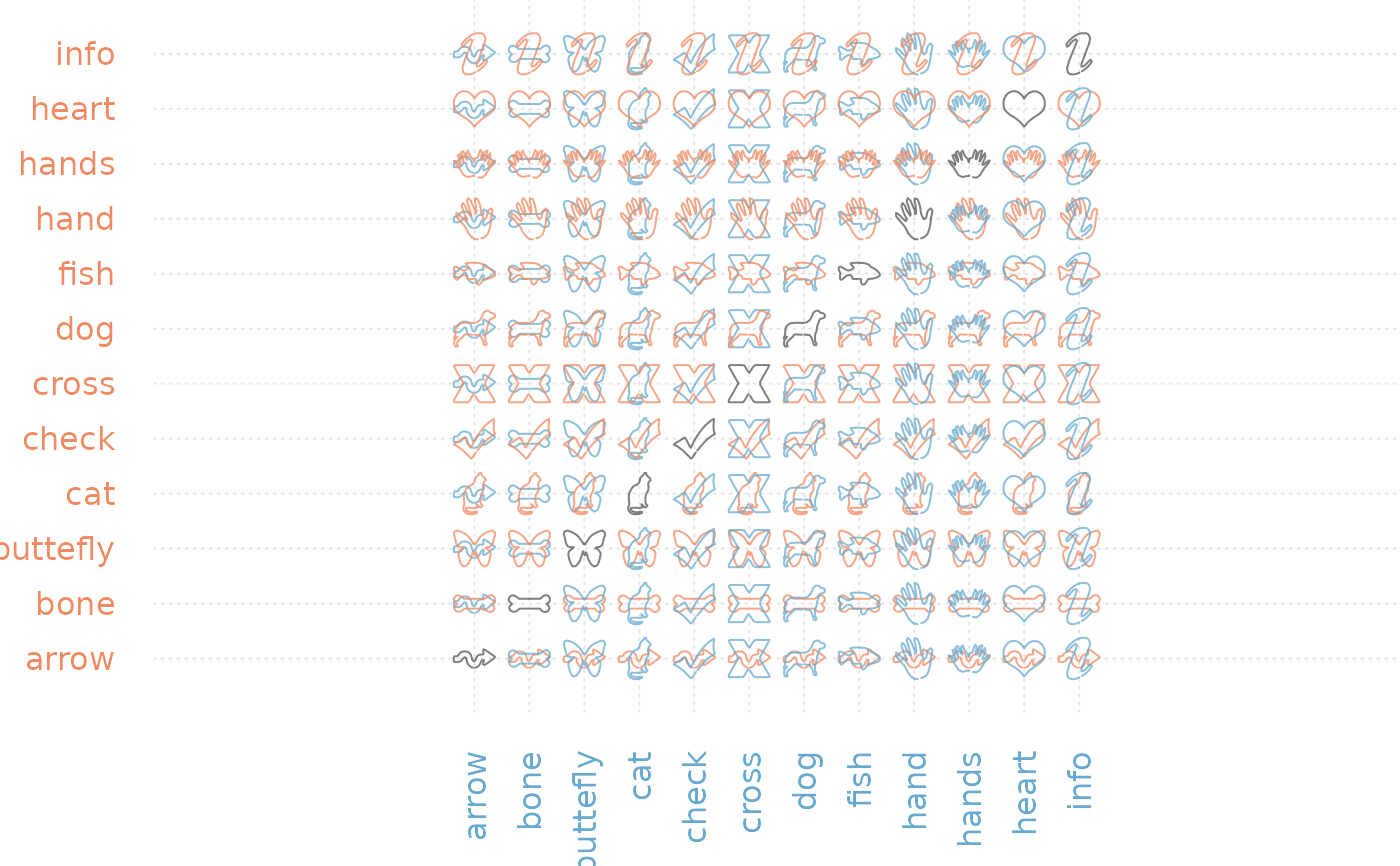
shapes %>%
# subset and degrade
slice(1:12) %>% coo_sample(60) %$% # grab the coo
coo %>%
plot_MSHAPES()
# or
shapes %>%
# subset and degrade
slice(1:12) %>% coo_sample(60) %$% # grab the coo
coo %>%
plot_MSHAPES()