Useful drawers for building custom shape plots using the grindr approach. See examples and vignettes.
Usage
draw_polygon(
  coo,
  f,
  col = par("fg"),
  fill = NA,
  lwd = 1,
  lty = 1,
  transp = 0,
  pal = pal_qual,
  ...
)

draw_outline(
  coo,
  f,
  col = par("fg"),
  fill = NA,
  lwd = 1,
  lty = 1,
  transp = 0,
  pal = pal_qual,
  ...
)

draw_outlines(
  coo,
  f,
  col = par("fg"),
  fill = NA,
  lwd = 1,
  lty = 1,
  transp = 0,
  pal = pal_qual,
  ...
)

draw_points(
  coo,
  f,
  col = par("fg"),
  cex = 1/2,
  pch = 20,
  transp = 0,
  pal = pal_qual,
  ...
)

draw_landmarks(
  coo,
  f,
  col = par("fg"),
  cex = 1/2,
  pch = 20,
  transp = 0,
  pal = pal_qual,
  ...
)

draw_lines(
  coo,
  f,
  col = par("fg"),
  lwd = 1,
  lty = 1,
  transp = 0,
  pal = pal_qual,
  ...
)

draw_centroid(
  coo,
  f,
  col = par("fg"),
  pch = 3,
  cex = 0.5,
  transp = 0,
  pal = pal_qual,
  ...
)

draw_curve(
  coo,
  f,
  col = par("fg"),
  lwd = 1,
  lty = 1,
  transp = 0,
  pal = pal_qual,
  ...
)

draw_curves(
  coo,
  f,
  col = par("fg"),
  lwd = 1,
  lty = 1,
  transp = 0,
  pal = pal_qual,
  ...
)

draw_firstpoint(
  coo,
  f,
  label = "^",
  col = par("fg"),
  cex = 3/4,
  transp = 0,
  pal = pal_qual,
  ...
)

draw_axes(coo, col = "#999999", lwd = 1/2, ...)

draw_ticks(coo, col = "#333333", cex = 3/4, lwd = 3/4, ...)

draw_labels(coo, labels = 1:nrow(coo), cex = 1/2, d = 1/20, ...)

draw_links(
  coo,
  f,
  links,
  col = "#99999955",
  lwd = 1/2,
  lty = 1,
  transp = 0,
  pal = pal_qual,
  ...
)

draw_title(
  coo,
  main = "",
  sub = "",
  cex = c(1, 3/4),
  font = c(2, 1),
  padding = 1/200,
  ...
)
Arguments
- coo
matrixof 2 columns for (x, y) coordinates- f
an optionnal factor specification to feed. See examples and vignettes.
- col
color (hexadecimal) to draw components
- fill
color (hexadecimal) to draw components
- lwd
to draw components
- lty
to draw components
- transp
numerictransparency (default:0, min:0, max:1)- pal
a palette to use if no col/border/etc. are provided. See
[palettes]- ...
additional options to feed core functions for each drawer
- cex
to draw components ((
c(2, 1)by default) fordraw_title)- pch
to draw components
- label
to indicate first point
- labels
charactername of labels to draw (defaut to1:nrow(coo))- d
numericproportion ofd(centroid-each_point)to add when centrifugating landmarks- links
matrixof links to use to draw segments between landmarks. Seewings$ldkfor an example- main
charactertitle (empty by default)- sub
charactersubtitle (empty by default)- font
numericto feed text (c(2, 1)by default)- padding
numerica fraction of the graphical window (1/200by default)
Note
This approach will (soon) replace coo_plot and friends in further versions. All comments are welcome.
See also
grindr_layers
Other grindr:
layers,
layers_morphospace,
mosaic_engine(),
papers,
pile(),
plot_LDA(),
plot_NMDS(),
plot_PCA()
Examples
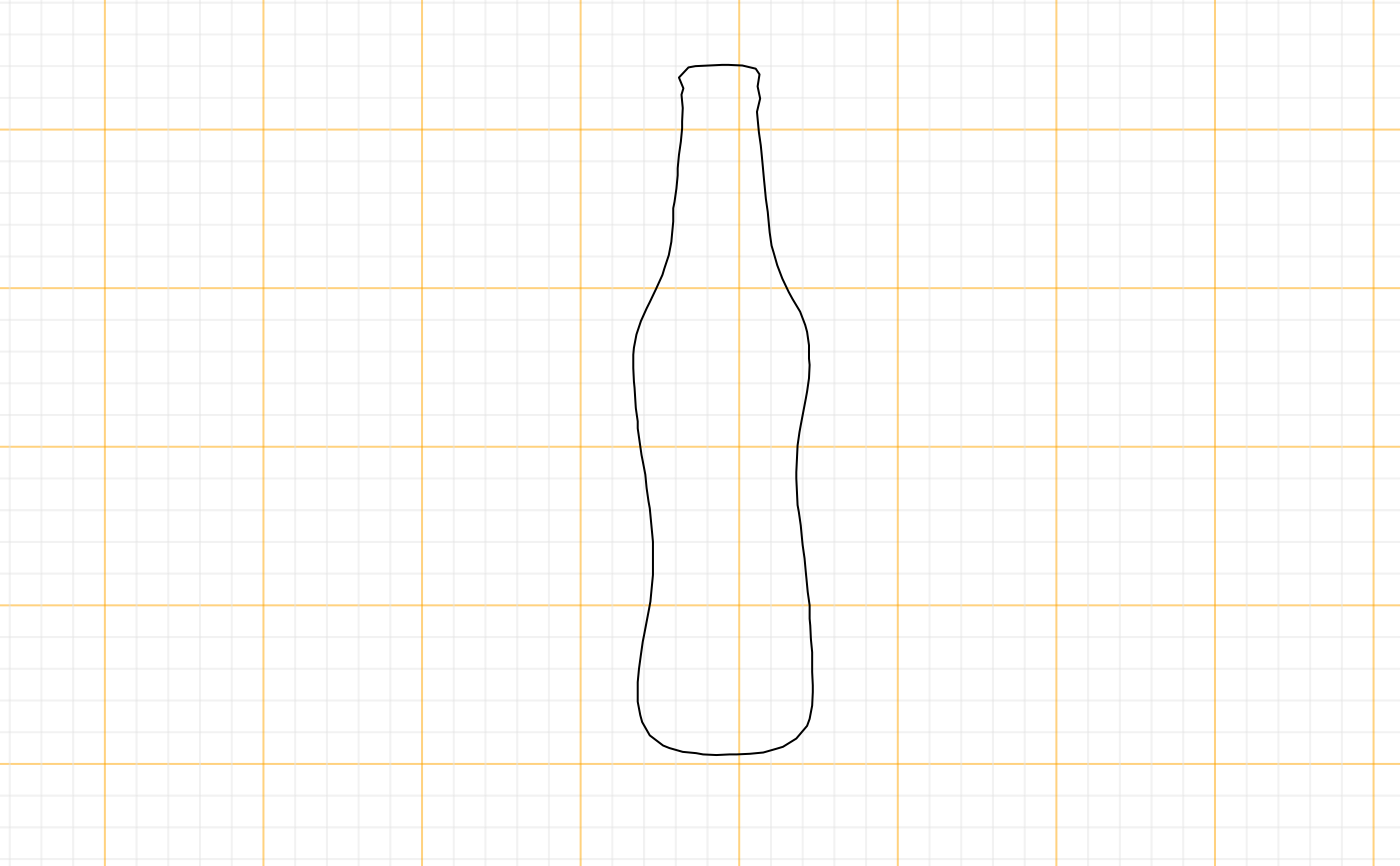
bot[1] %>% paper_grid() %>% draw_polygon()

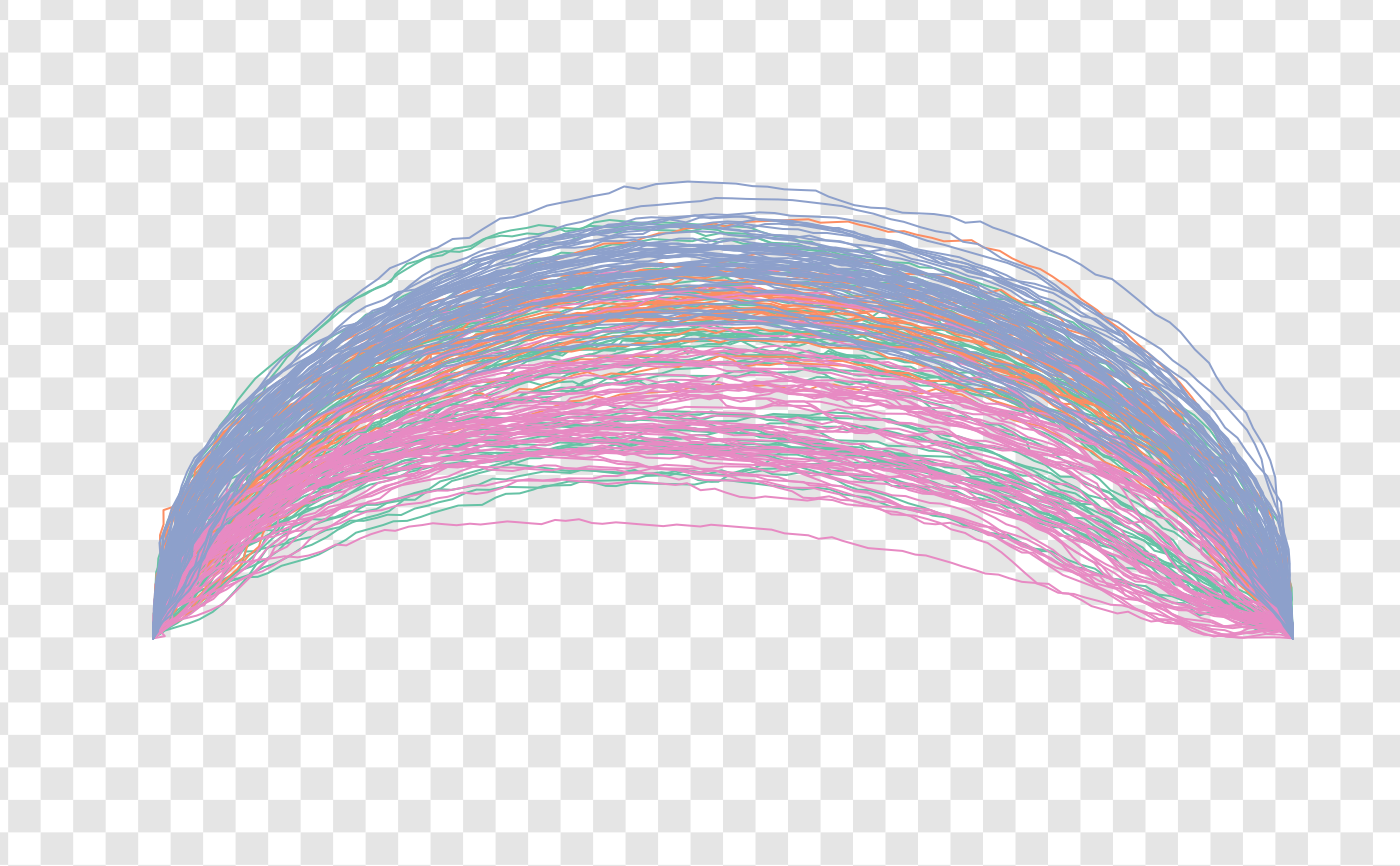
olea %>% paper_chess %>% draw_lines(~var)


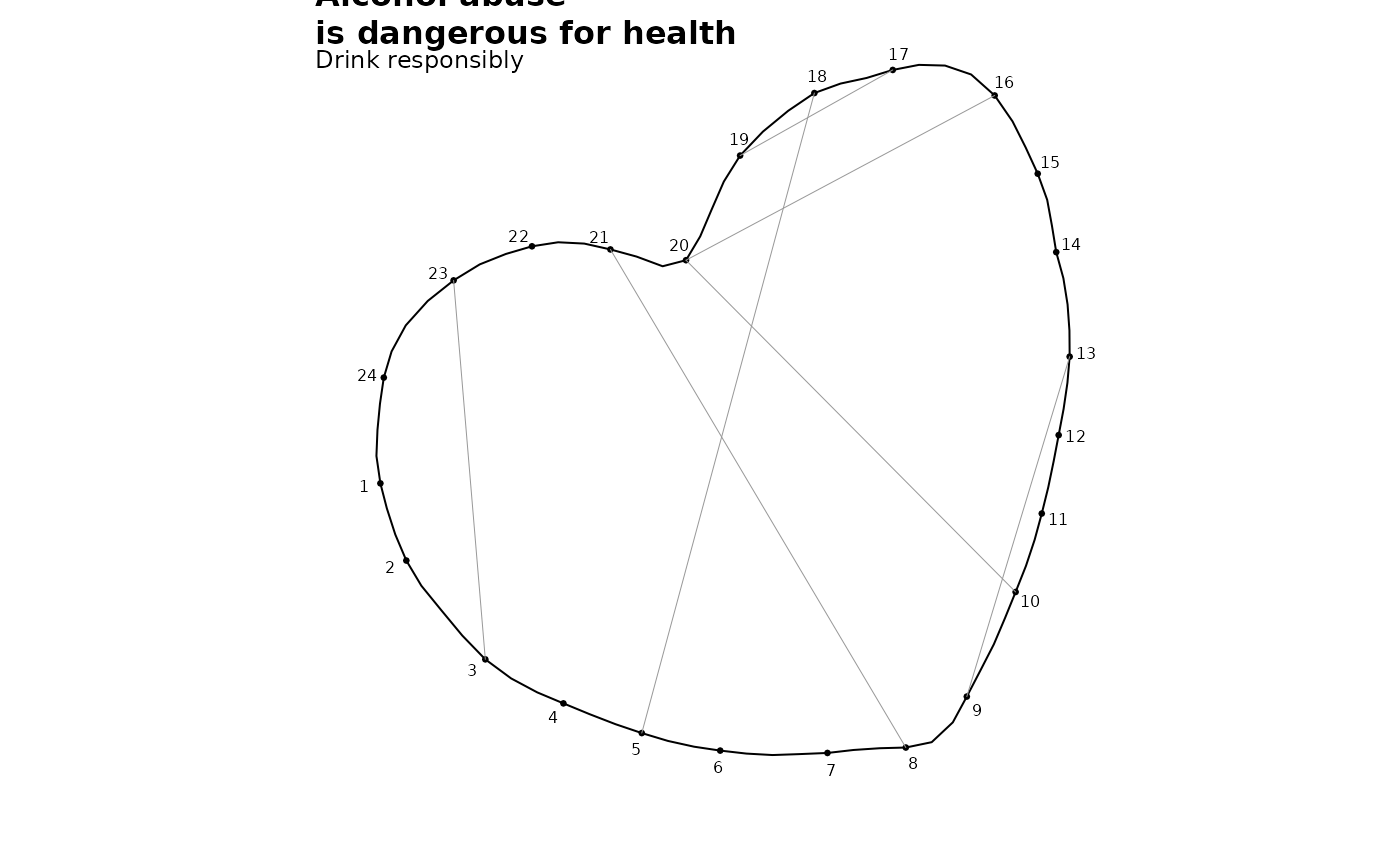
hearts[240] %>% paper_white() %>% draw_outline() %>%
  coo_sample(24) %>% draw_landmarks %>% draw_labels() %>%
  draw_links(links=replicate(2, sample(1:24, 8)))

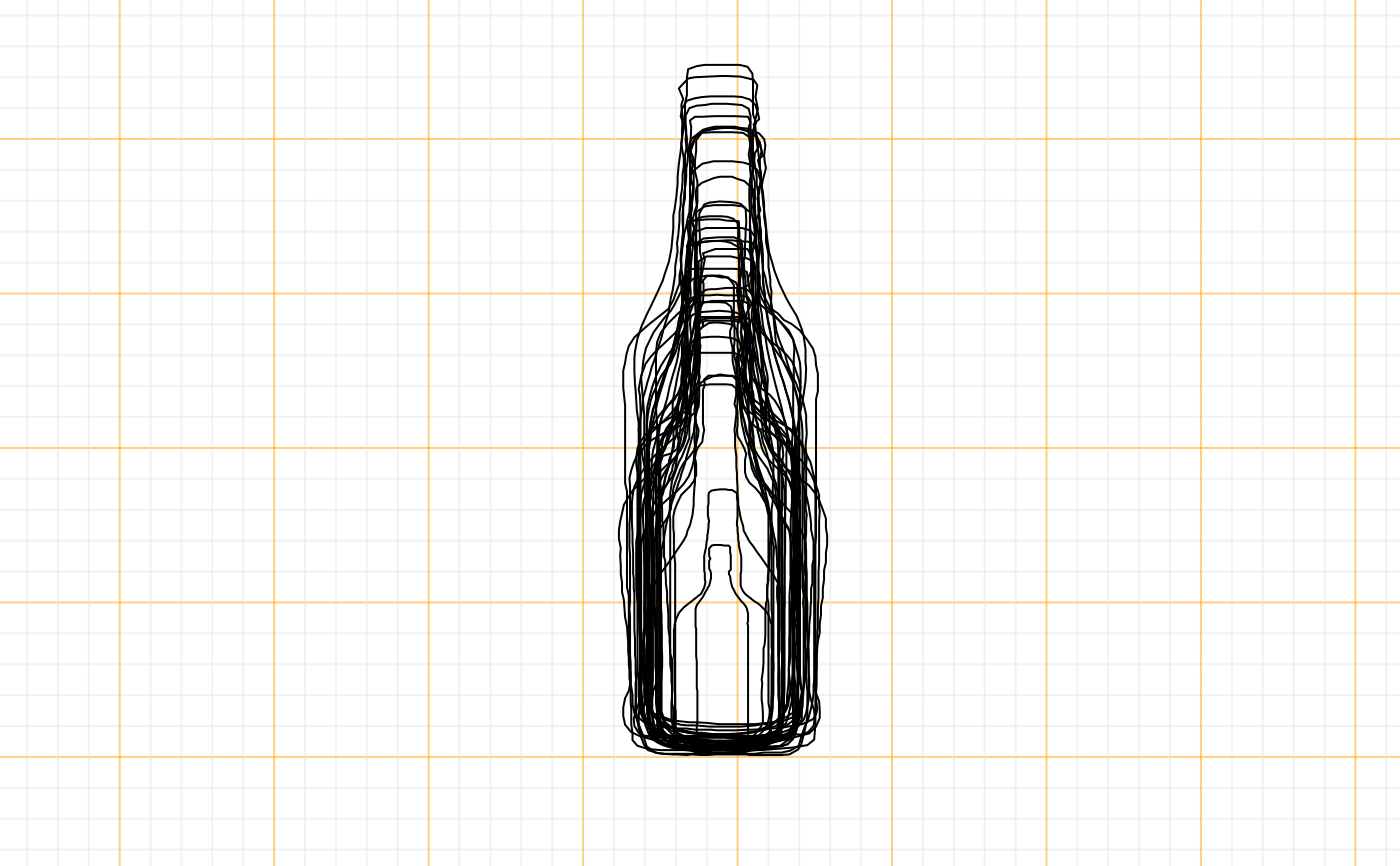
bot %>%
    paper_grid() %>%
    draw_outlines() %>%
    draw_title("Alcohol abuse \nis dangerous for health", "Drink responsibly")


