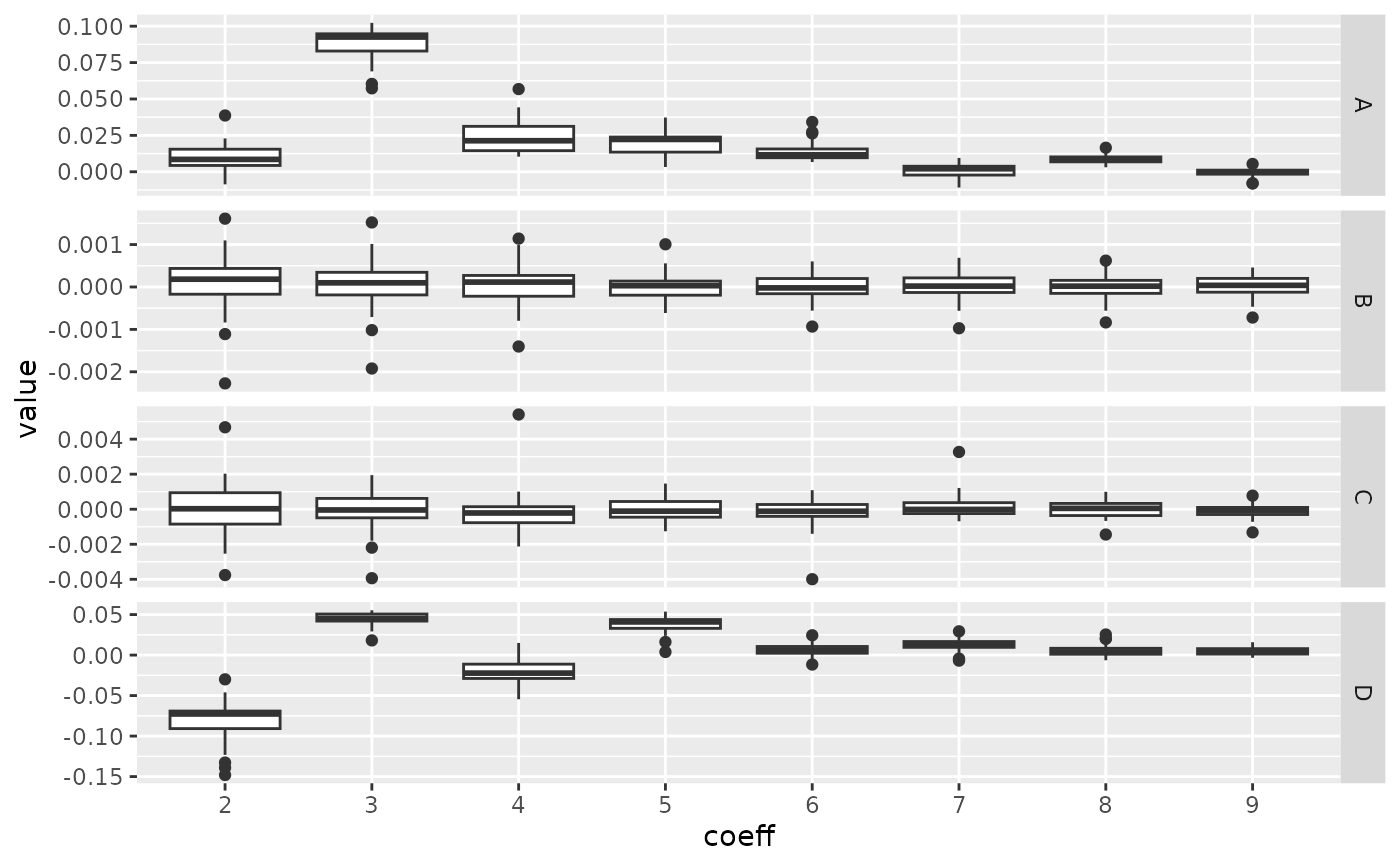
Explores the distribution of coefficient values.
Usage
# S3 method for class 'OutCoe'
boxplot(x, ...)
Arguments
- x
the Coe object
- ...
useless here
See also
Other Coe_graphics:
hcontrib()
Explores the distribution of coefficient values.
# S3 method for class 'OutCoe'
boxplot(x, ...)the Coe object
useless here
Other Coe_graphics:
hcontrib()