Useful to display differences between shapes
See also
Other plotting functions:
coo_arrows(),
coo_draw(),
coo_listpanel(),
coo_lolli(),
coo_plot(),
ldk_chull(),
ldk_confell(),
ldk_contour(),
ldk_labels(),
ldk_links(),
plot_devsegments(),
plot_table()
Other plotting functions:
coo_arrows(),
coo_draw(),
coo_listpanel(),
coo_lolli(),
coo_plot(),
ldk_chull(),
ldk_confell(),
ldk_contour(),
ldk_labels(),
ldk_links(),
plot_devsegments(),
plot_table()
Examples
ms <- MSHAPES(efourier(bot , 10), "type")
#> 'norm=TRUE' is used and this may be troublesome. See ?efourier #Details
b <- ms$shp$beer
w <- ms$shp$whisky
# we obtain the mean shape, then euclidean distances between points
m <- MSHAPES(list(b, w))
d <- edm(b, w)
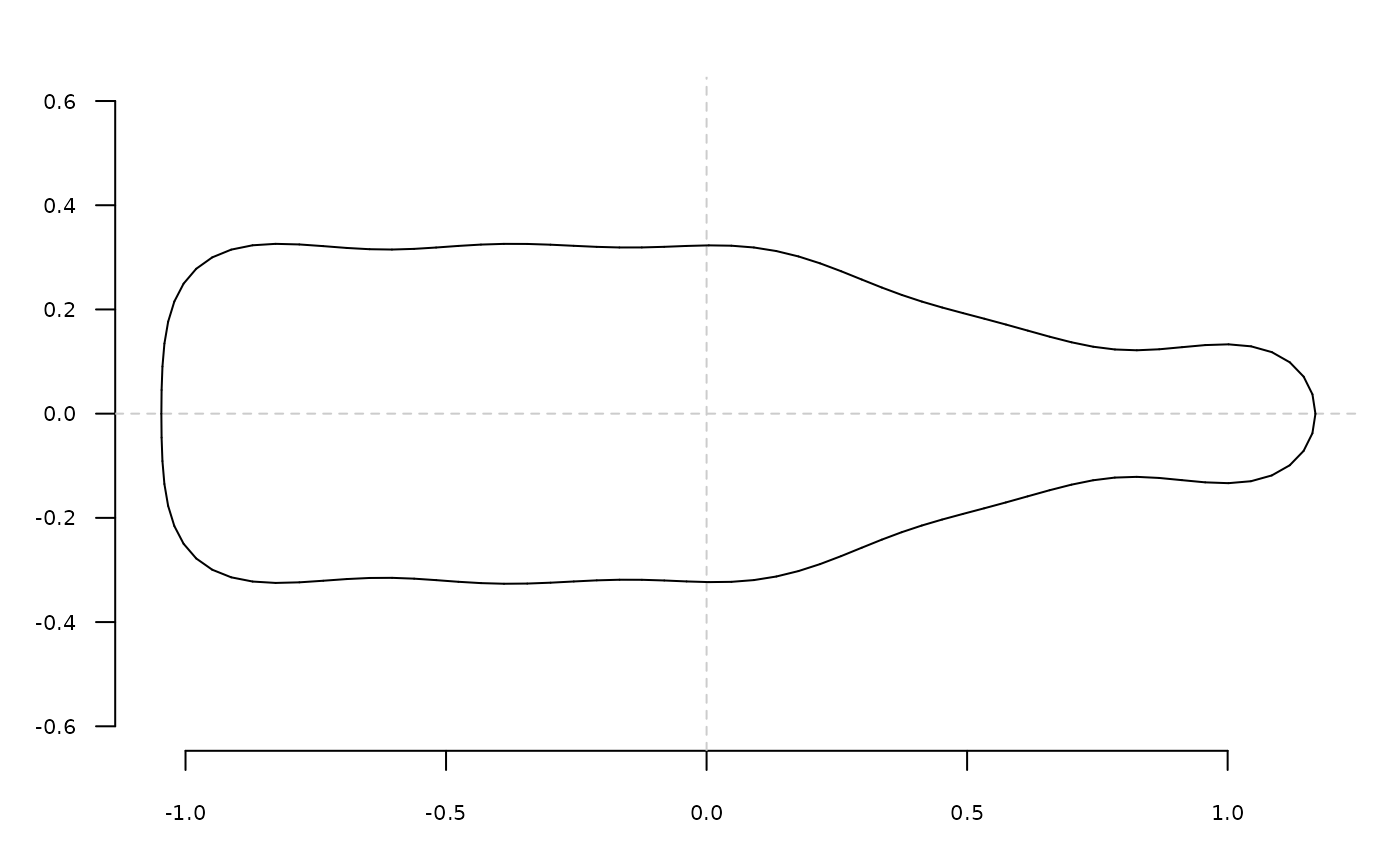
# First plot
coo_plot(m, plot=FALSE)
coo_draw(b)
coo_draw(w)
coo_ruban(m, d, lwd=5)
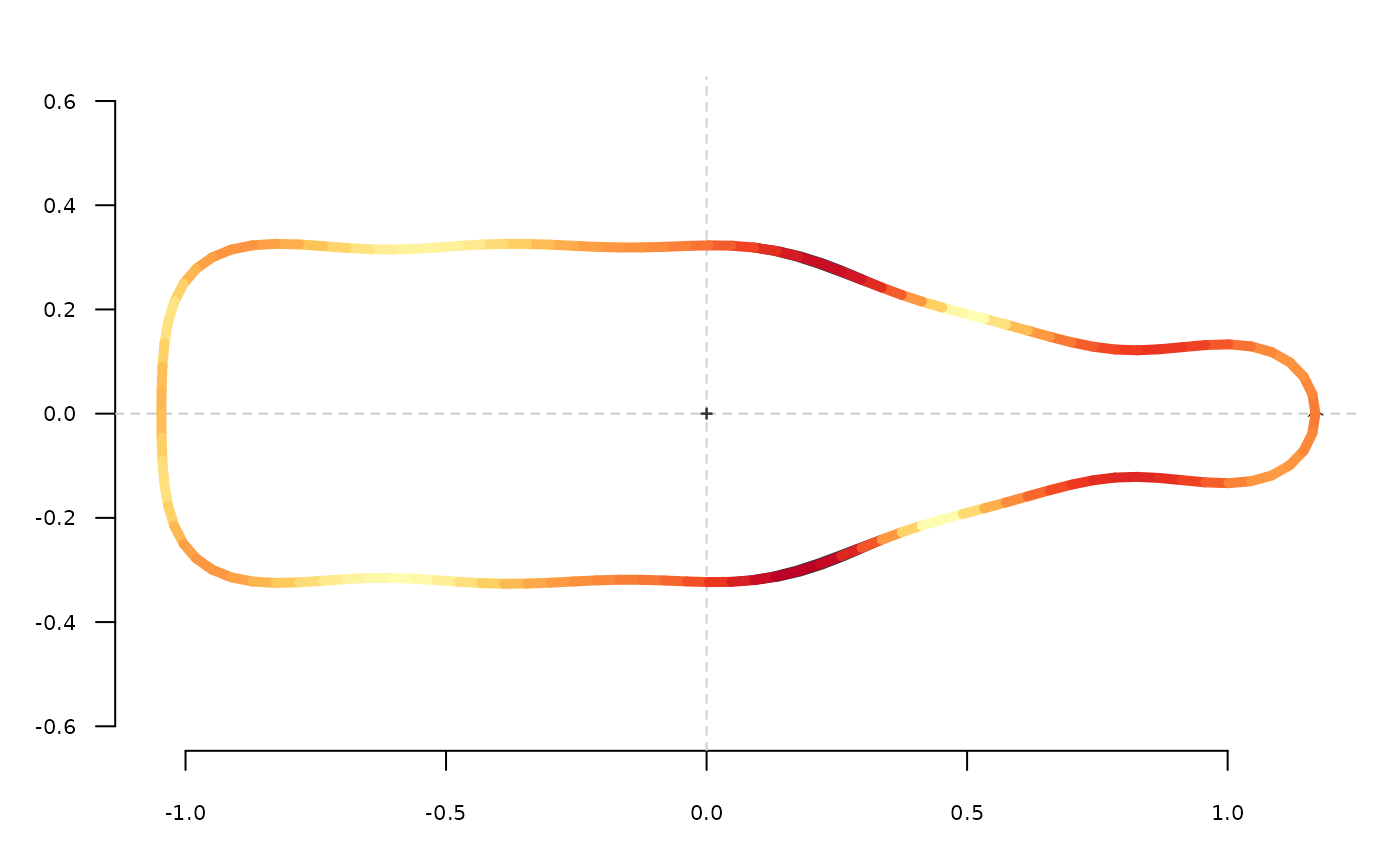 #Another example
coo_plot(m, plot=FALSE)
coo_ruban(m, d, palette=col_summer2, lwd=5)
#Another example
coo_plot(m, plot=FALSE)
coo_ruban(m, d, palette=col_summer2, lwd=5)
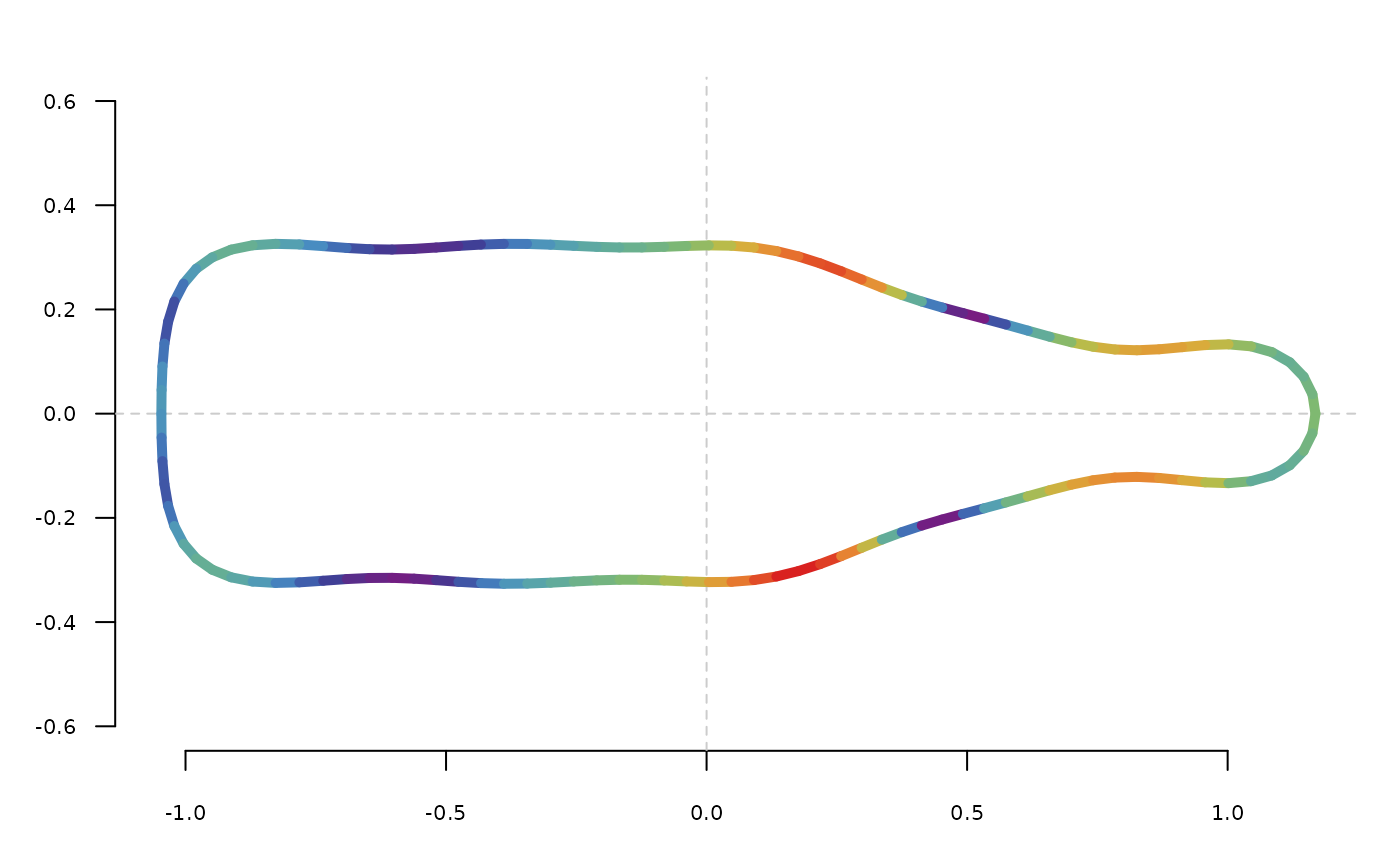 #If you want linewidth rather than color
coo_plot(m, plot=FALSE)
coo_ruban(m, d, palette=col_black)
#If you want linewidth rather than color
coo_plot(m, plot=FALSE)
coo_ruban(m, d, palette=col_black)