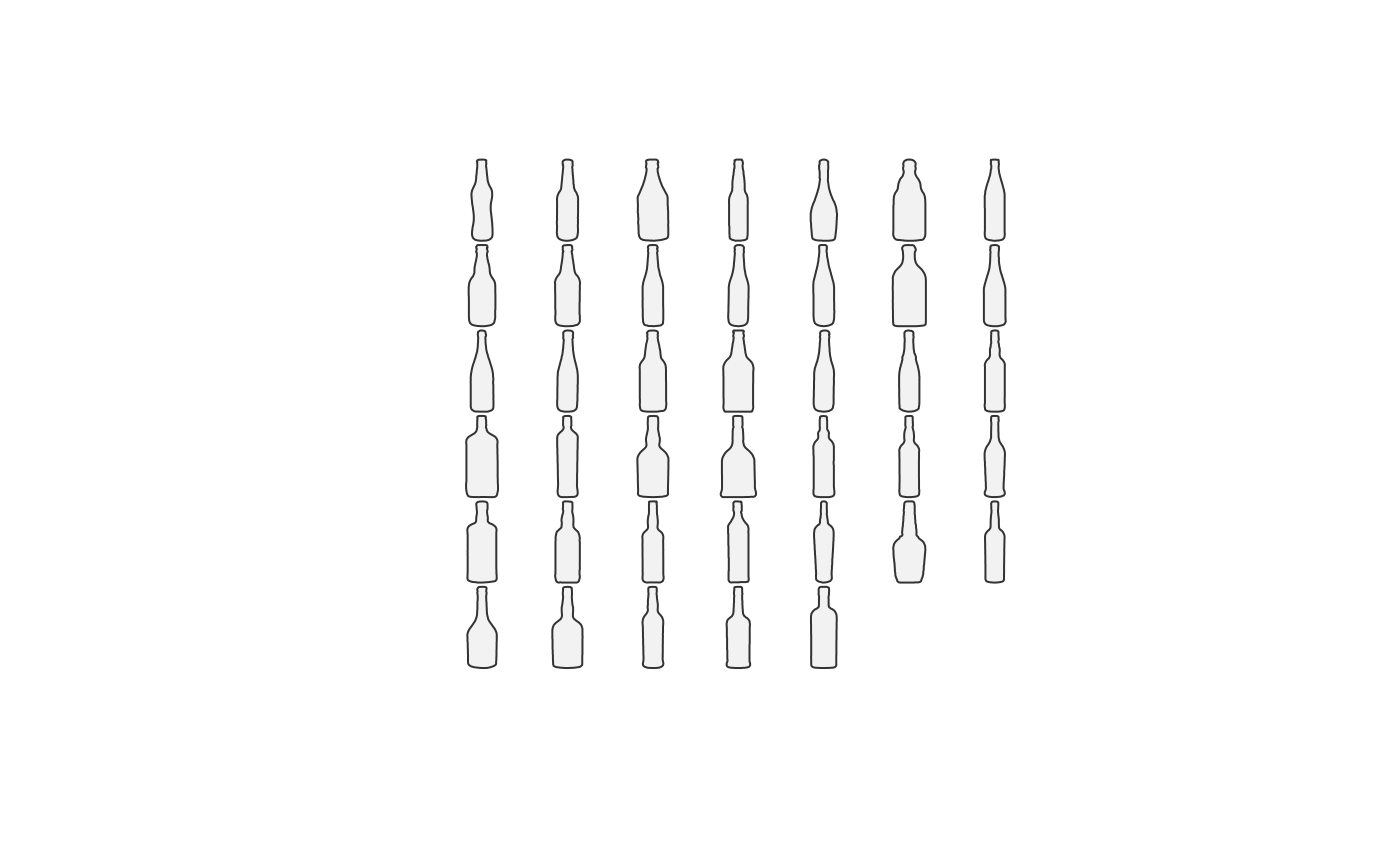
coo_listpanel plots a list of shapes if passed with a list of
coordinates. Mainly used by panel.Coo functions. If used outside the latter,
shapes must be "templated", see coo_template. If you want to reorder shapes
according to a factor, use arrange.
Usage
coo_listpanel(
  coo.list,
  dim,
  byrow = TRUE,
  fromtop = TRUE,
  cols,
  borders,
  poly = TRUE,
  points = FALSE,
  points.pch = 3,
  points.cex = 0.2,
  points.col = "#333333",
  ...
)
Arguments
- coo.list
A
listof coordinates- dim
A
vectorof the form(nb.row, nb.cols)to specify the panel display. If missing, shapes are arranged in a square.- byrow
logical. Whether to draw successive shape by row or by col.- fromtop
logical. Whether to display shapes from the top of the plotting region.- cols
A
vectorof colors to fill shapes.- borders
A
vectorof colors to draw shape borders.- poly
logical whether to use polygon or lines to draw shapes. mainly for use for outlines and open outlines.
- points
logical if poly is set to FALSE whether to add points
- points.pch
if points is TRUE, a pch for these points
- points.cex
if points is TRUE, a cex for these points
- points.col
if points is TRUE, a col for these points
- ...
additional arguments to feed generic
plot
Value
Returns (invisibly) a data.frame with position of shapes that
can be used for other sophisticated plotting design.
See also
Other plotting functions:
coo_arrows(),
coo_draw(),
coo_lolli(),
coo_plot(),
coo_ruban(),
ldk_chull(),
ldk_confell(),
ldk_contour(),
ldk_labels(),
ldk_links(),
plot_devsegments(),
plot_table()