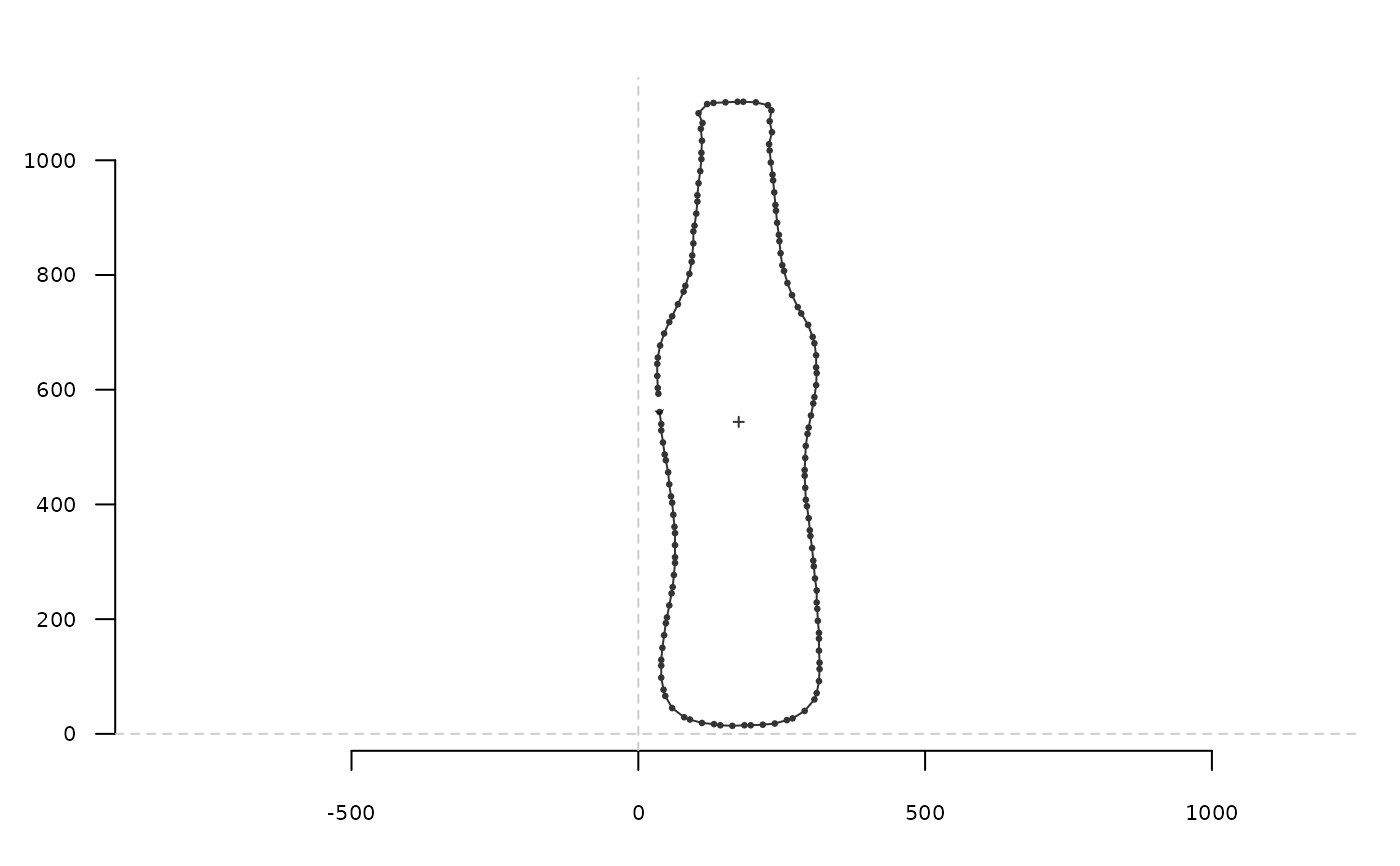
A simple wrapper around plot for plotting shapes. Widely used in Momocs in other graphical functions, in methods, etc.
Usage
coo_plot(
  coo,
  xlim,
  ylim,
  border = "#333333",
  col = NA,
  lwd = 1,
  lty = 1,
  points = FALSE,
  first.point = TRUE,
  cex.first.point = 0.5,
  centroid = TRUE,
  xy.axis = TRUE,
  pch = 1,
  cex = 0.5,
  main = NA,
  poly = TRUE,
  plot.new = TRUE,
  plot = TRUE,
  zoom = 1,
  ...
)

ldk_plot(coo, ...)
Arguments
- coo
A
listor amatrixof coordinates.- xlim
If
coo_plotis called andcoois missing, then a vector of length 2 specifying theylimof the ploting area.- ylim
If
coo_plotis called andcoois missing, then a vector of length 2 specifying theylimof the ploting area.- border
A color for the shape border.
- col
A color to fill the shape polygon.
- lwd
The
lwdfor drawing shapes.- lty
The
ltyfor drawing shapes.- points
logical. Whether to display points. If missing and number of points is < 100, then points are plotted.- first.point
logicalwhether to plot or not the first point.- cex.first.point
numericsize of this first point- centroid
logical. Whether to display centroid.- xy.axis
logical. Whether to draw the xy axis.- pch
The
pchfor points.- cex
The
cexfor points.- main
character. A title for the plot.- poly
logical whether to use polygon and lines to draw the shape, or just points. In other words, whether the shape should be considered as a configuration of landmarks or not (eg a closed outline).
- plot.new
logicalwhether to plot or not a new frame.- plot
logical whether to plot something or just to create an empty plot.
- zoom
a numeric to take your distances.
- ...
further arguments for use in coo_plot methods. See examples.
See also
Other plotting functions:
coo_arrows(),
coo_draw(),
coo_listpanel(),
coo_lolli(),
coo_ruban(),
ldk_chull(),
ldk_confell(),
ldk_contour(),
ldk_labels(),
ldk_links(),
plot_devsegments(),
plot_table()