Display one or more shapes arranged in a grid layout with automatic positioning.
Usage
mosaic(
  x,
  ratio = NULL,
  nrow = NULL,
  ncol = NULL,
  relative = TRUE,
  .label = NULL,
  label_cex = 0.5,
  ...,
  .cols = NULL,
  .ldk_col = NULL
)
Arguments
- x
A matrix (nx2), list of matrices, or tibble with coo columns.
- ratio
Numeric. Target aspect ratio (width/height) for the mosaic. If NULL and nrow/ncol not specified, creates square-ish layout.
- nrow
Integer. Number of rows in the grid.
- ncol
Integer. Number of columns in the grid.
- relative
Logical. If TRUE (default), uses
coo_template_relatively()to preserve relative sizes. If FALSE, usescoo_template()to scale all shapes to the same size.- .label
Column name for labels to display at each shape's origin. Only works with tibbles. Can be specified with or without quotes.
- label_cex
Numeric. Character expansion for labels. Default is 0.5.
- ...
Additional arguments (reserved for future use).
- .cols
Column name(s) to process when
xis a tibble. IfNULL, automatically detects columns containing coo objects.- .ldk_col
Character. Name of landmark column. If
NULL, usescolname_ldk.
Details
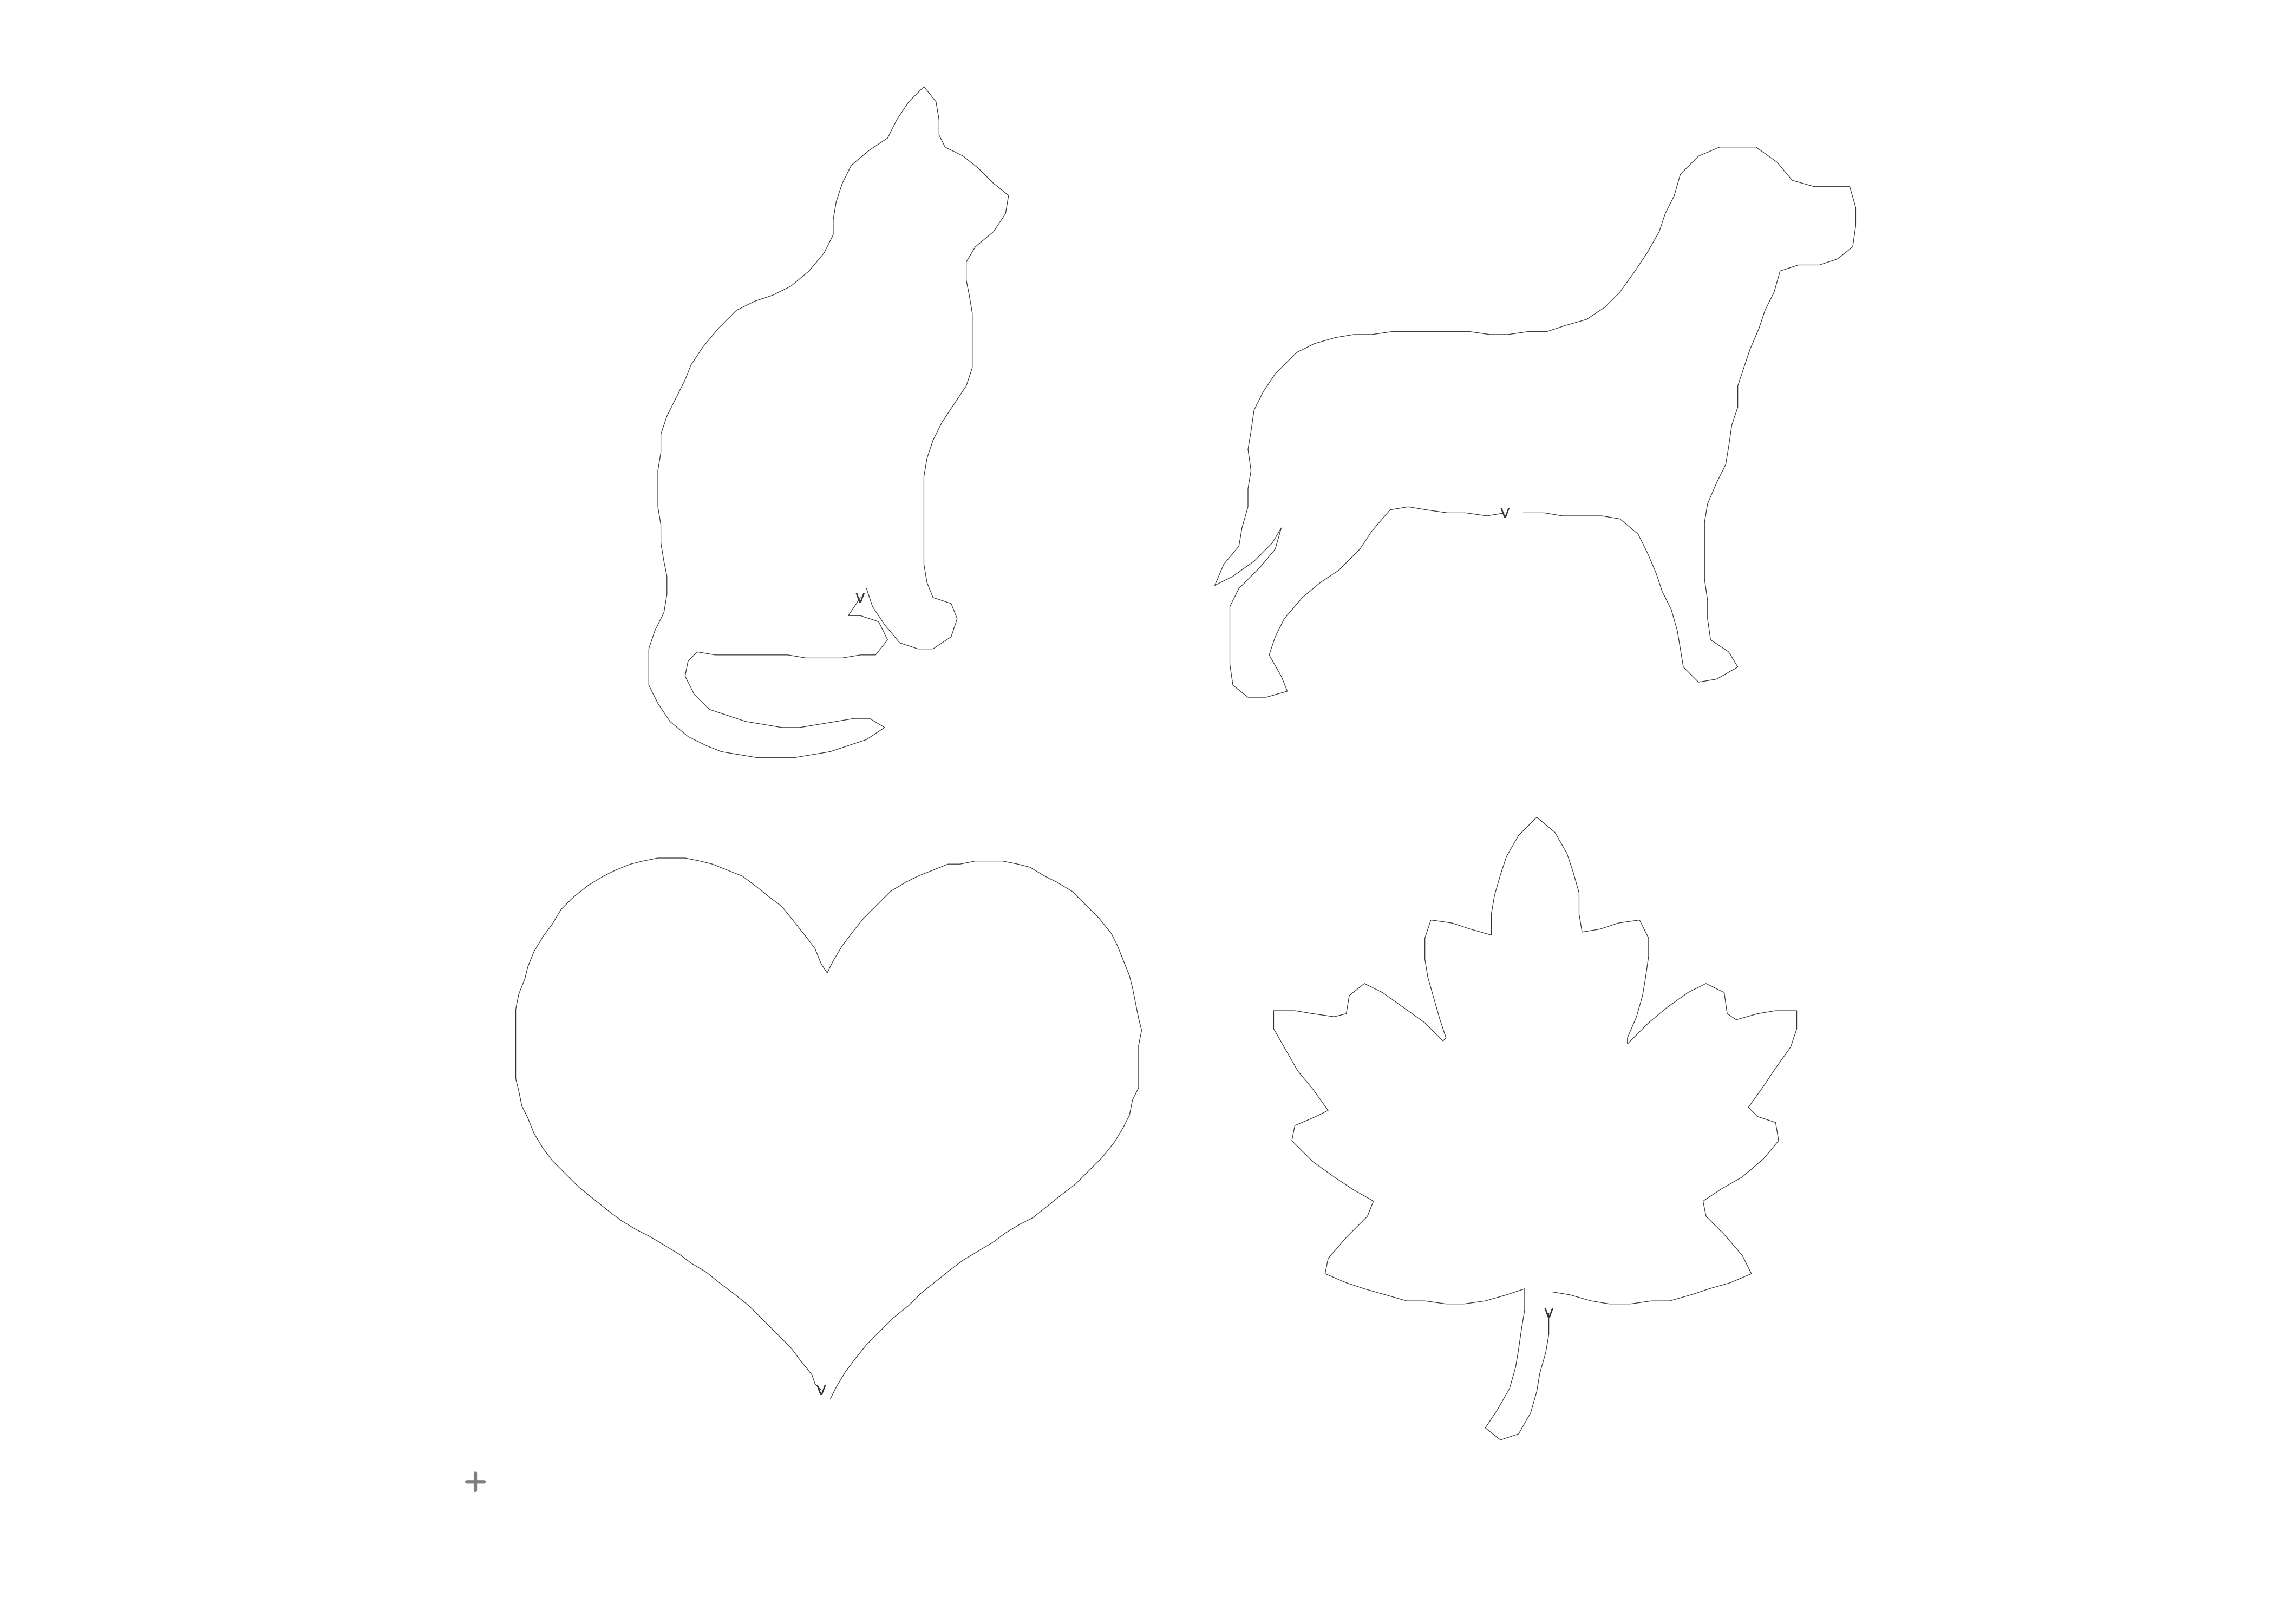
Arranges shapes in a grid mosaic. By default, shapes are templated relatively to preserve their size relationships - perfect for family pictures!
Works with:
Single matrix: plots that shape
List of matrices: arranges all shapes in grid
Tibble: arranges all shapes from coo column (or specified
.cols)
Grid dimensions can be controlled via nrow, ncol, or ratio. If none
are specified, creates a square-ish layout.
If a tibble has a landmark column (e.g., coo_ldk), landmarks will be drawn
in addition to outlines. Otherwise, falls back to heuristic: if shapes have
fewer than 32 points, draws as landmarks; otherwise draws as outlines.
Examples
mosaic(shapes$cat)
 mosaic(shapes)
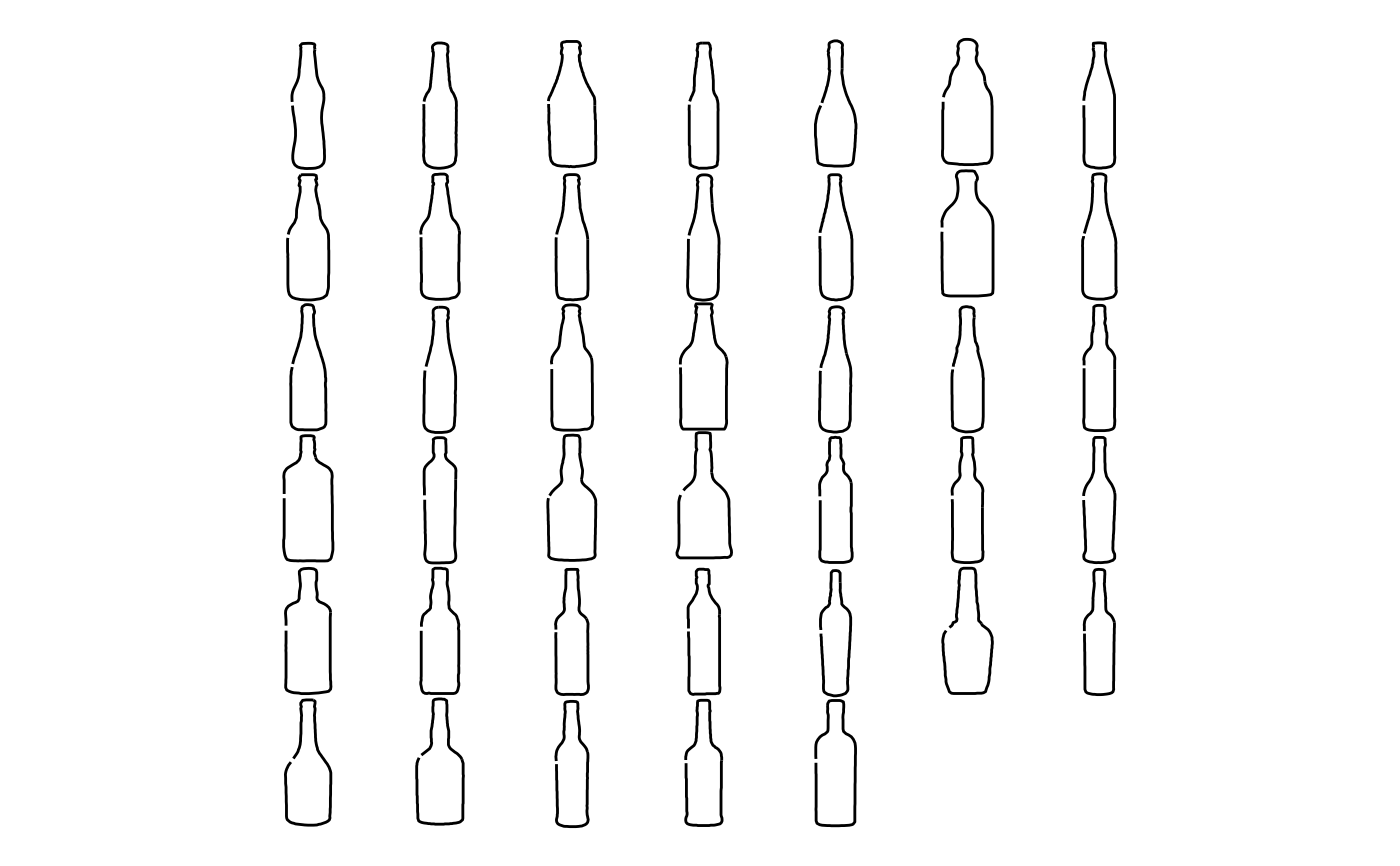
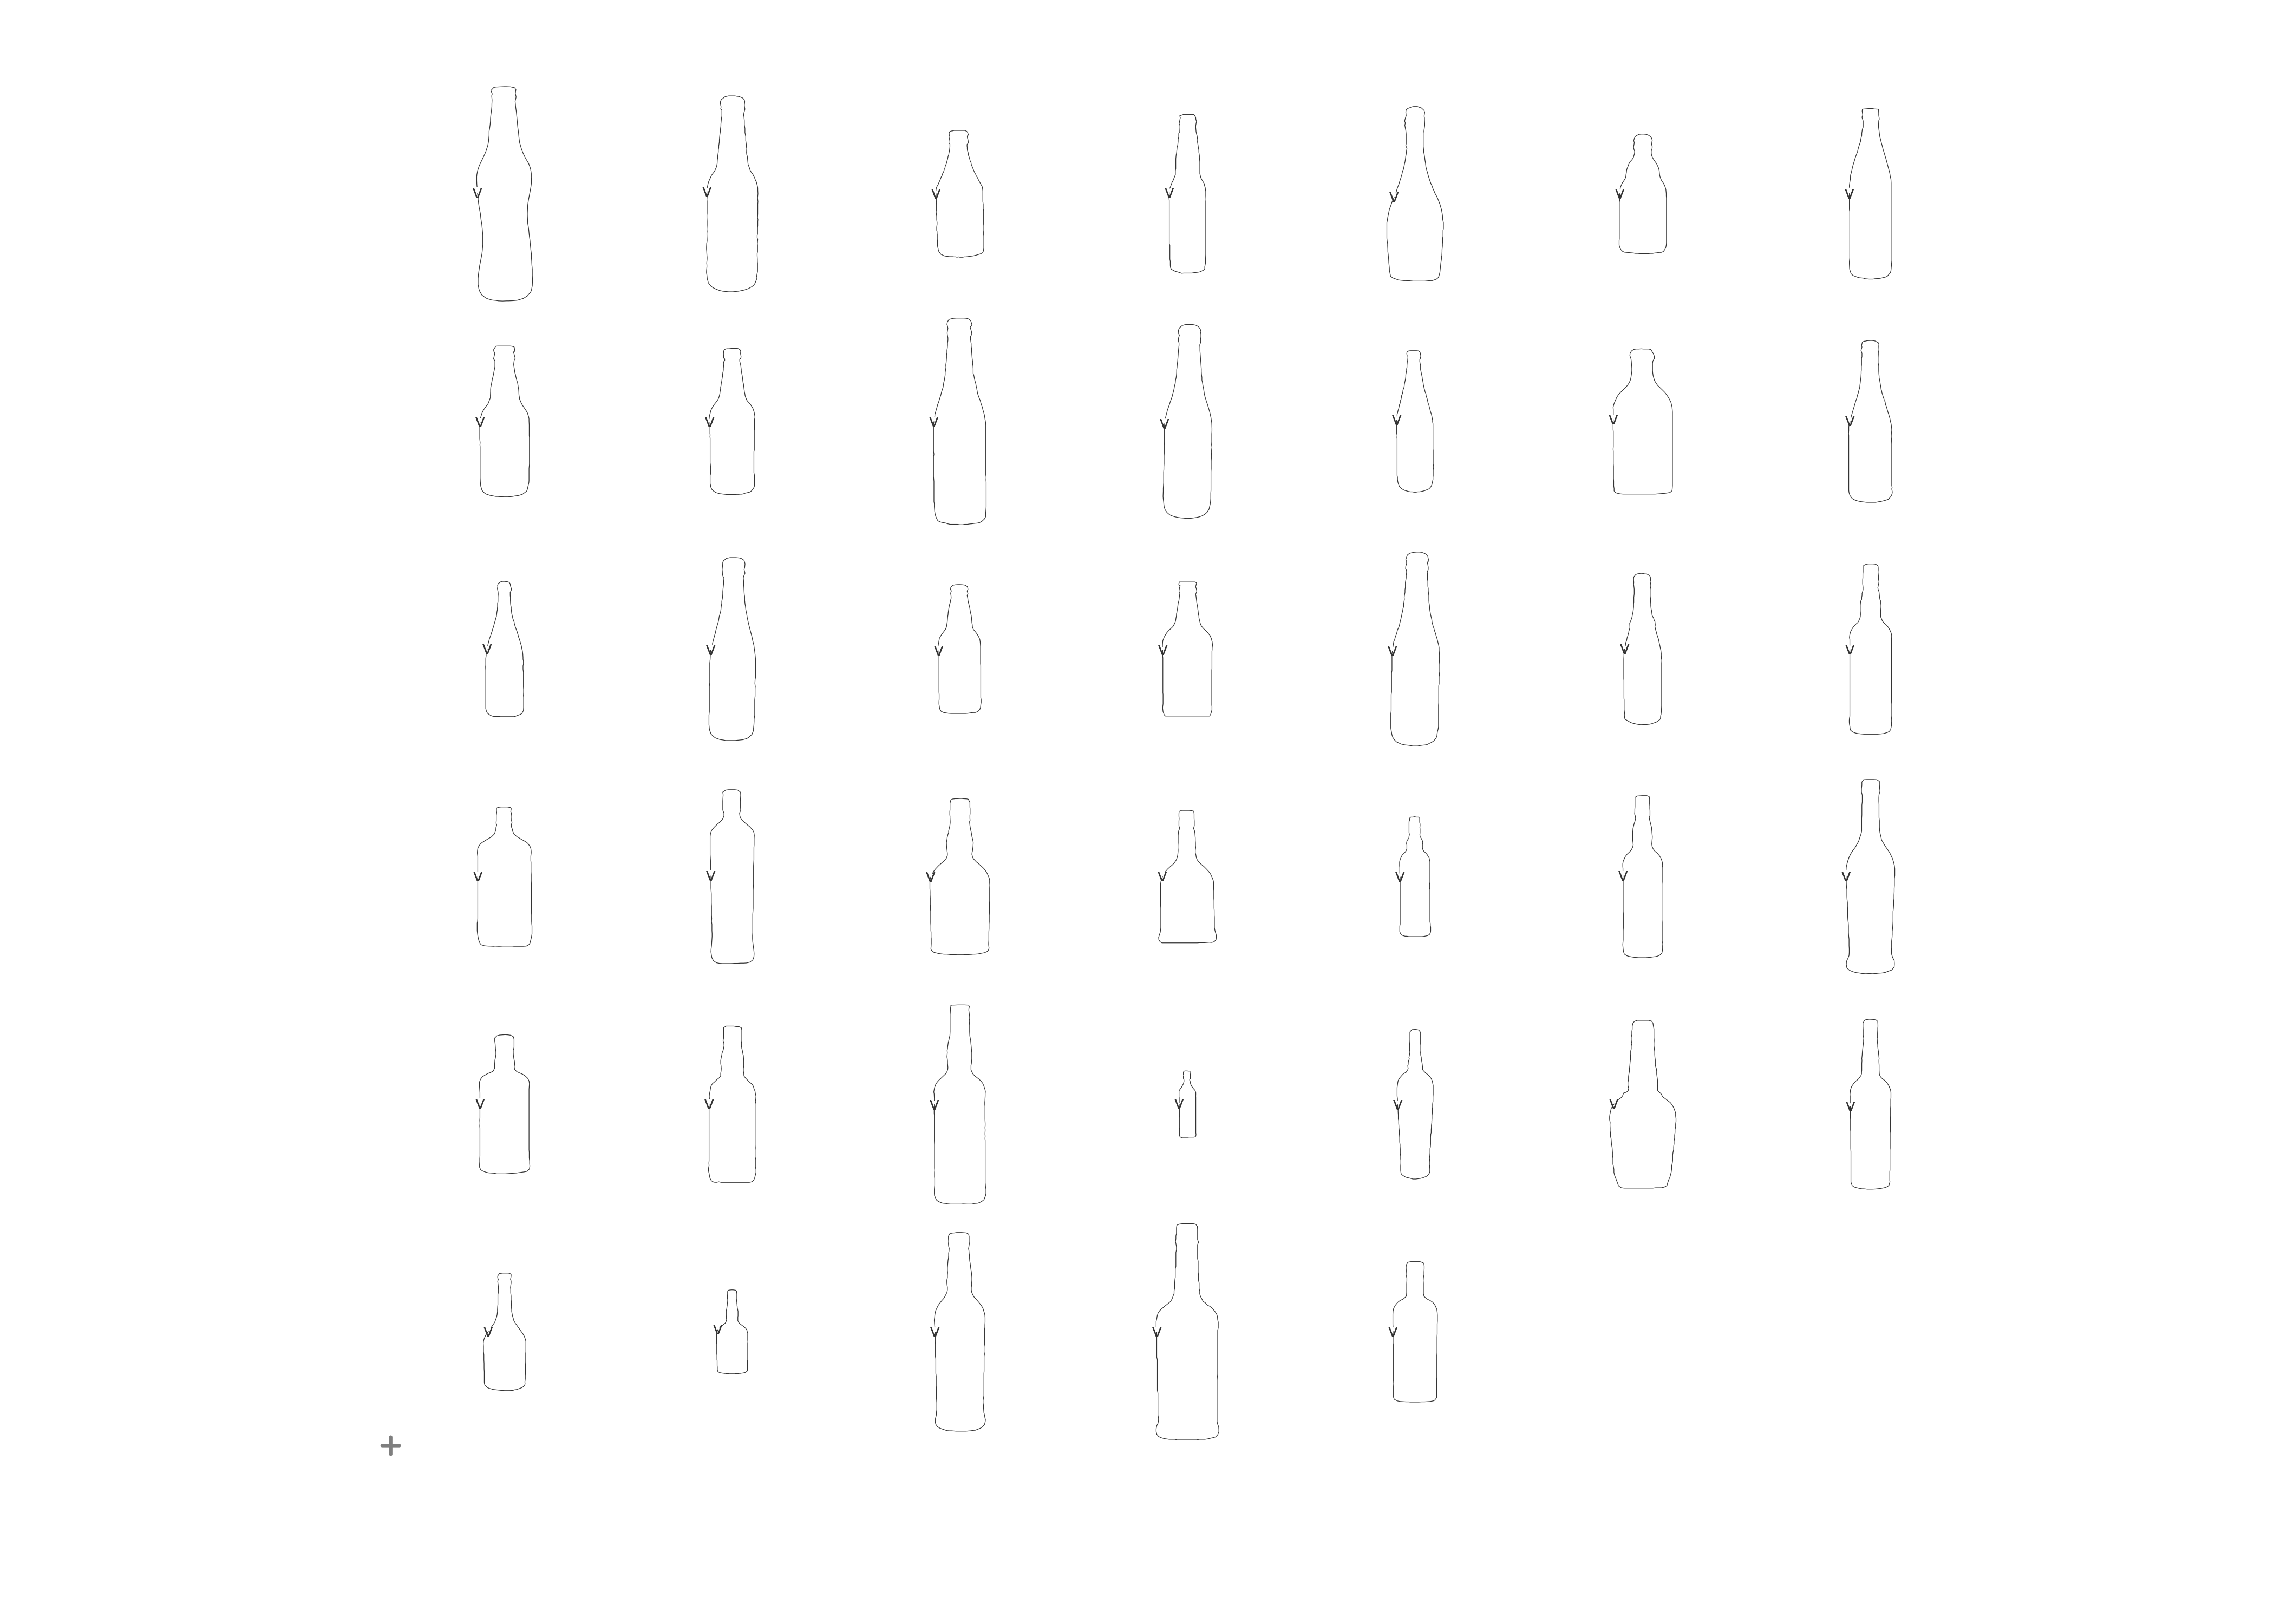
 mosaic(bot)
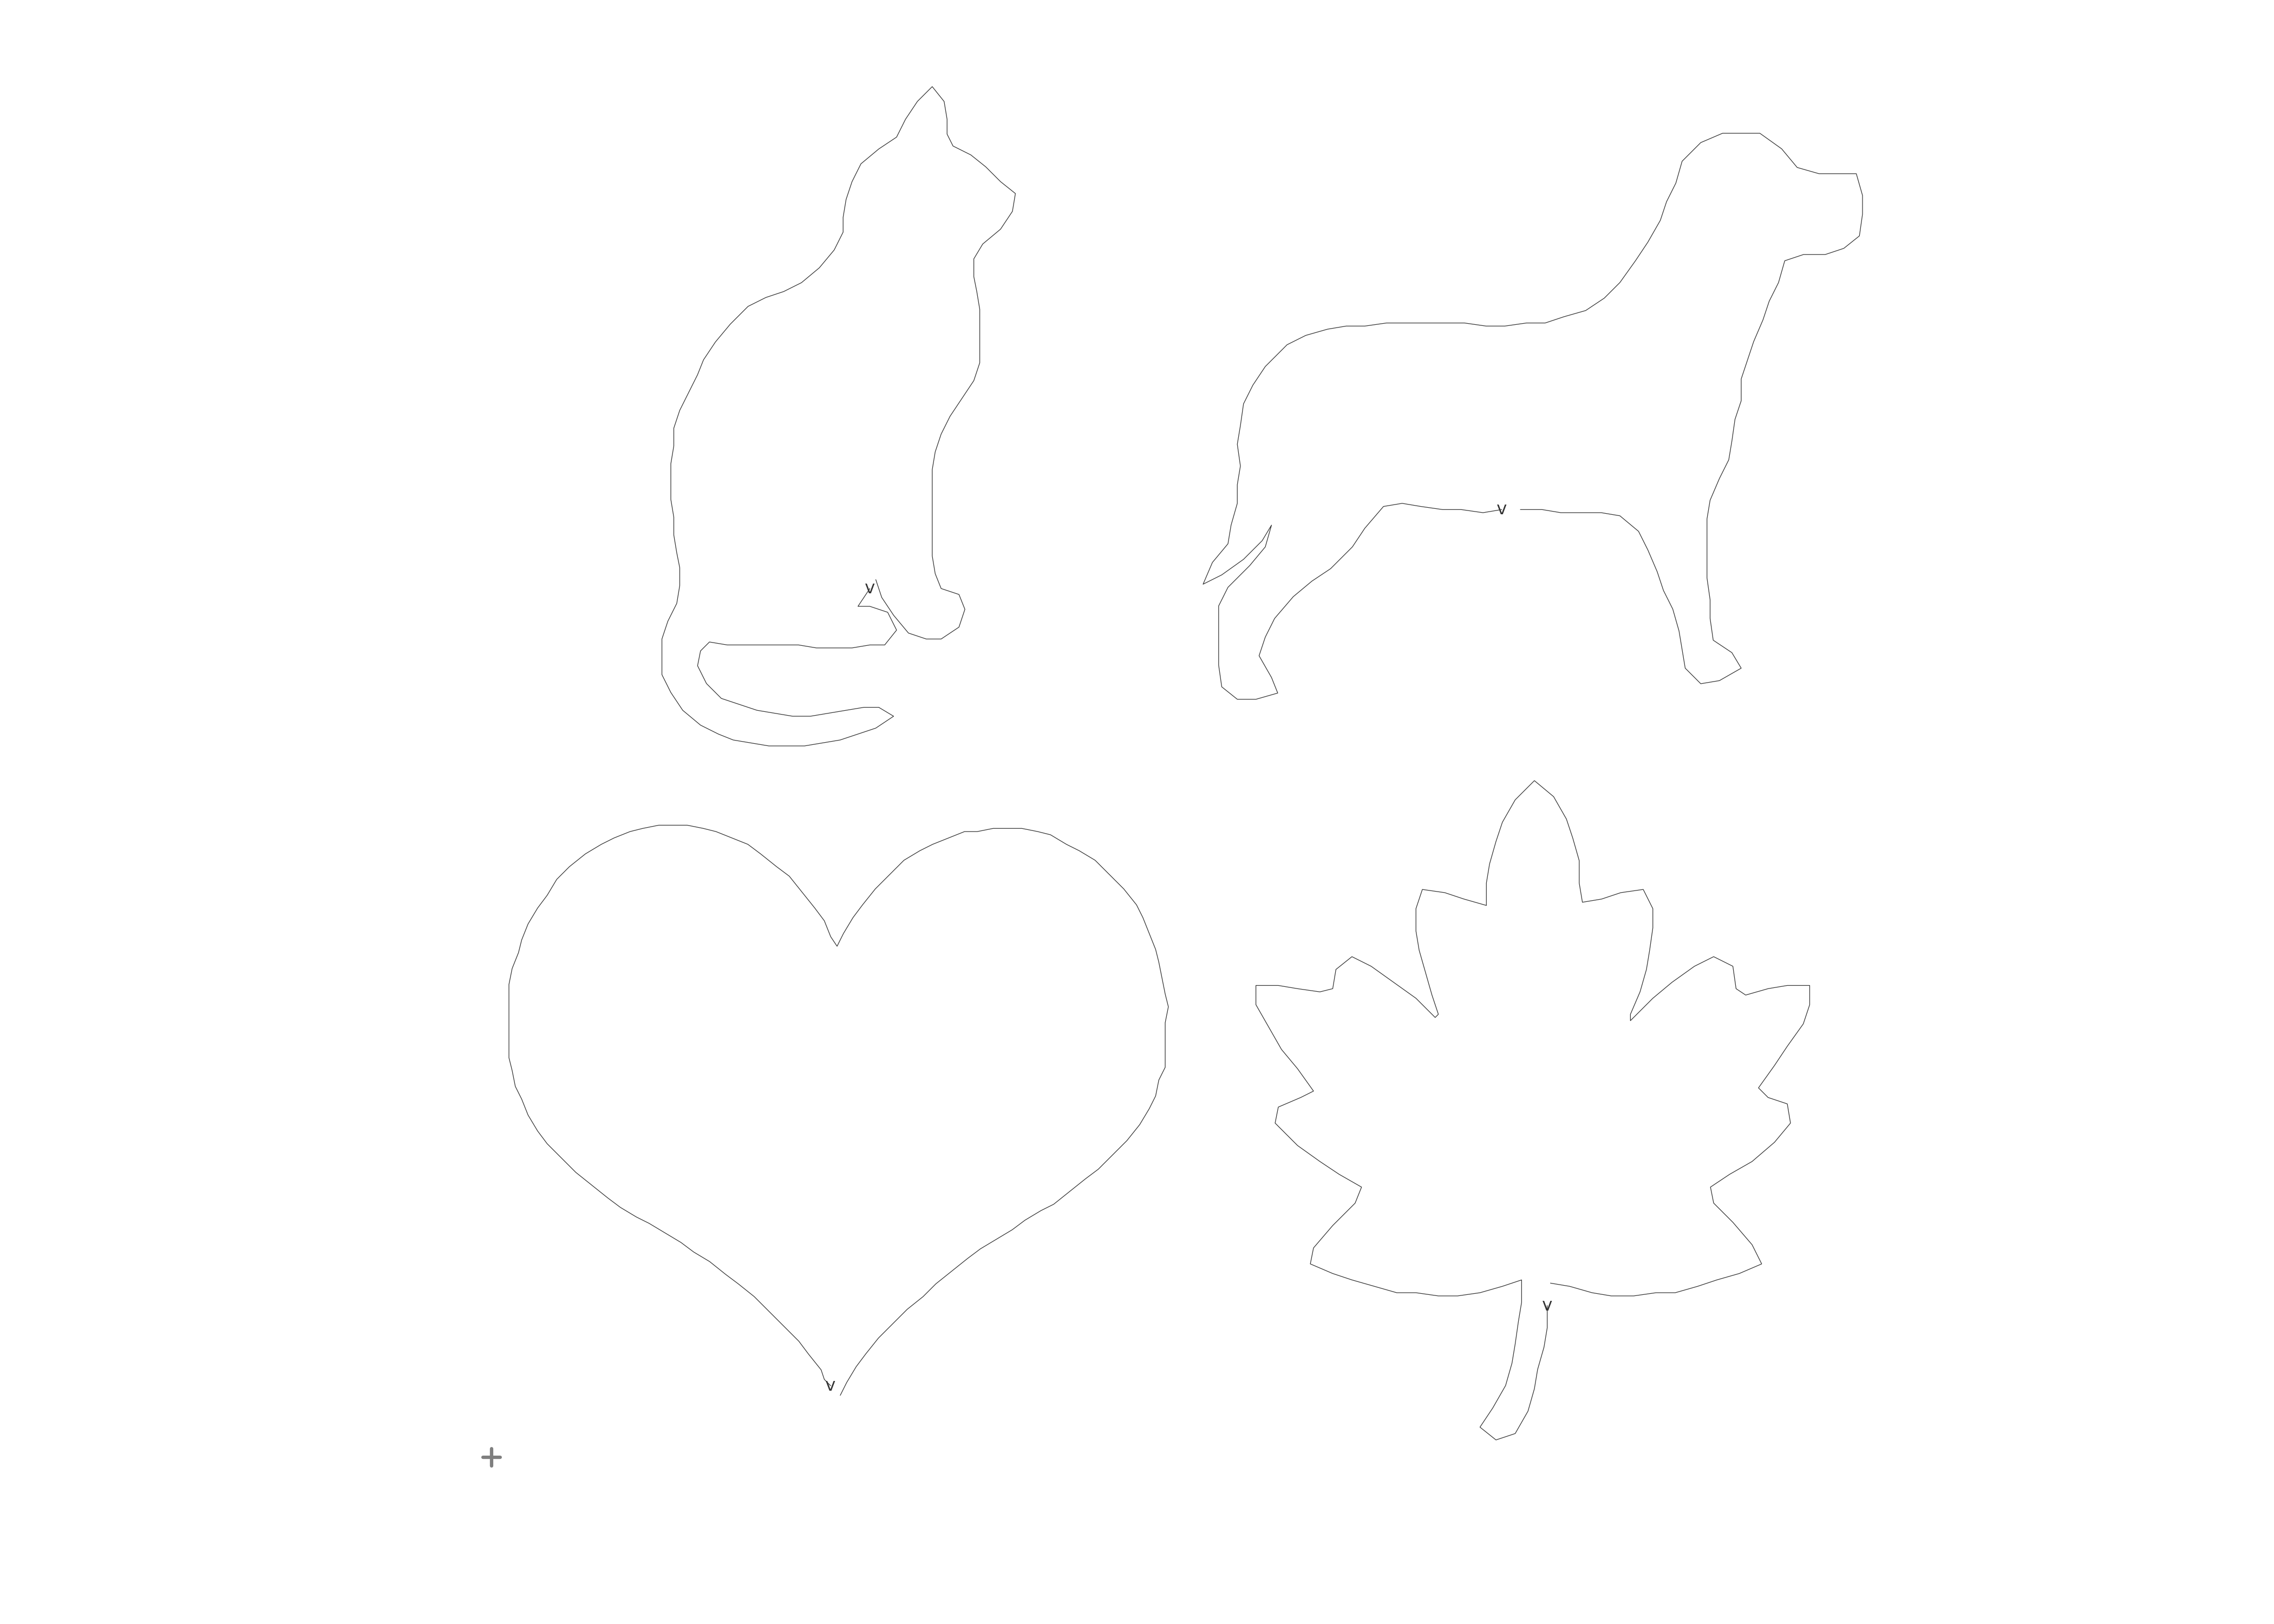
 mosaic(shapes, nrow = 2)
 mosaic(shapes, ratio = 16/9)
# Preserve relative sizes (default)
shapes %>% mosaic(relative = TRUE)
# All same size
shapes %>% mosaic(relative = FALSE)
mosaic(shapes, ratio = 16/9)
# Preserve relative sizes (default)
shapes %>% mosaic(relative = TRUE)
# All same size
shapes %>% mosaic(relative = FALSE)
 # With labels from tibble column
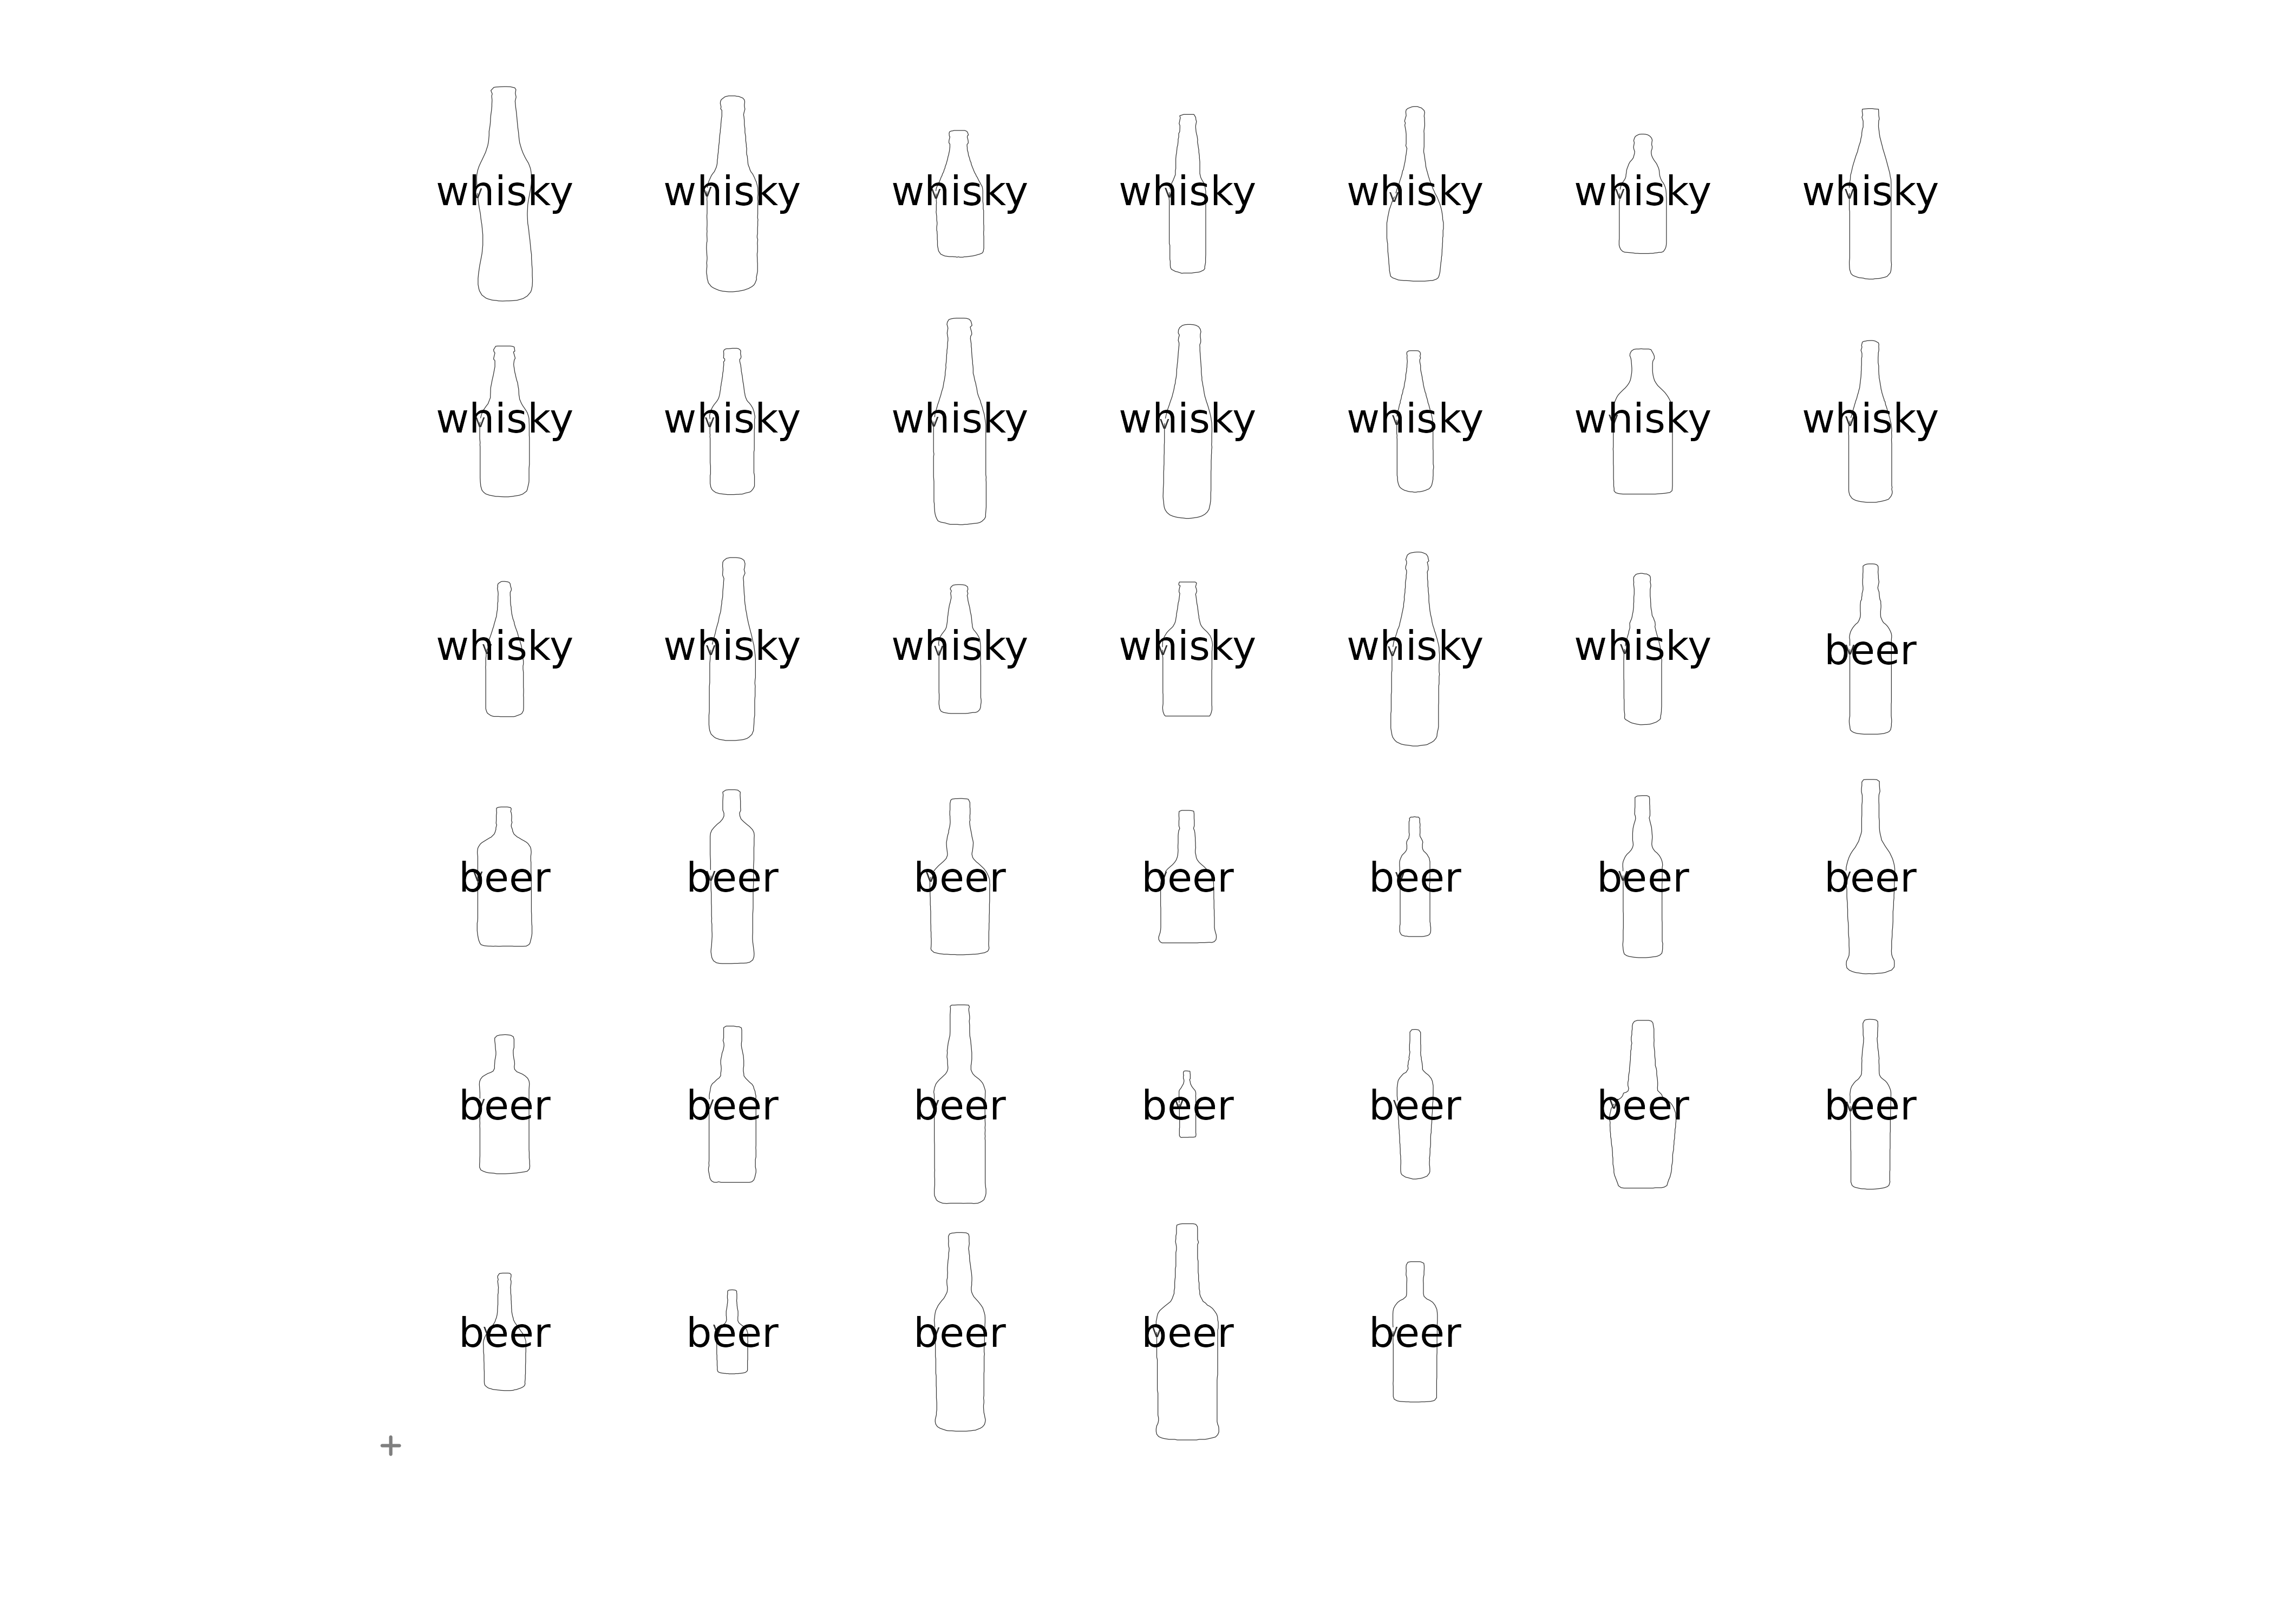
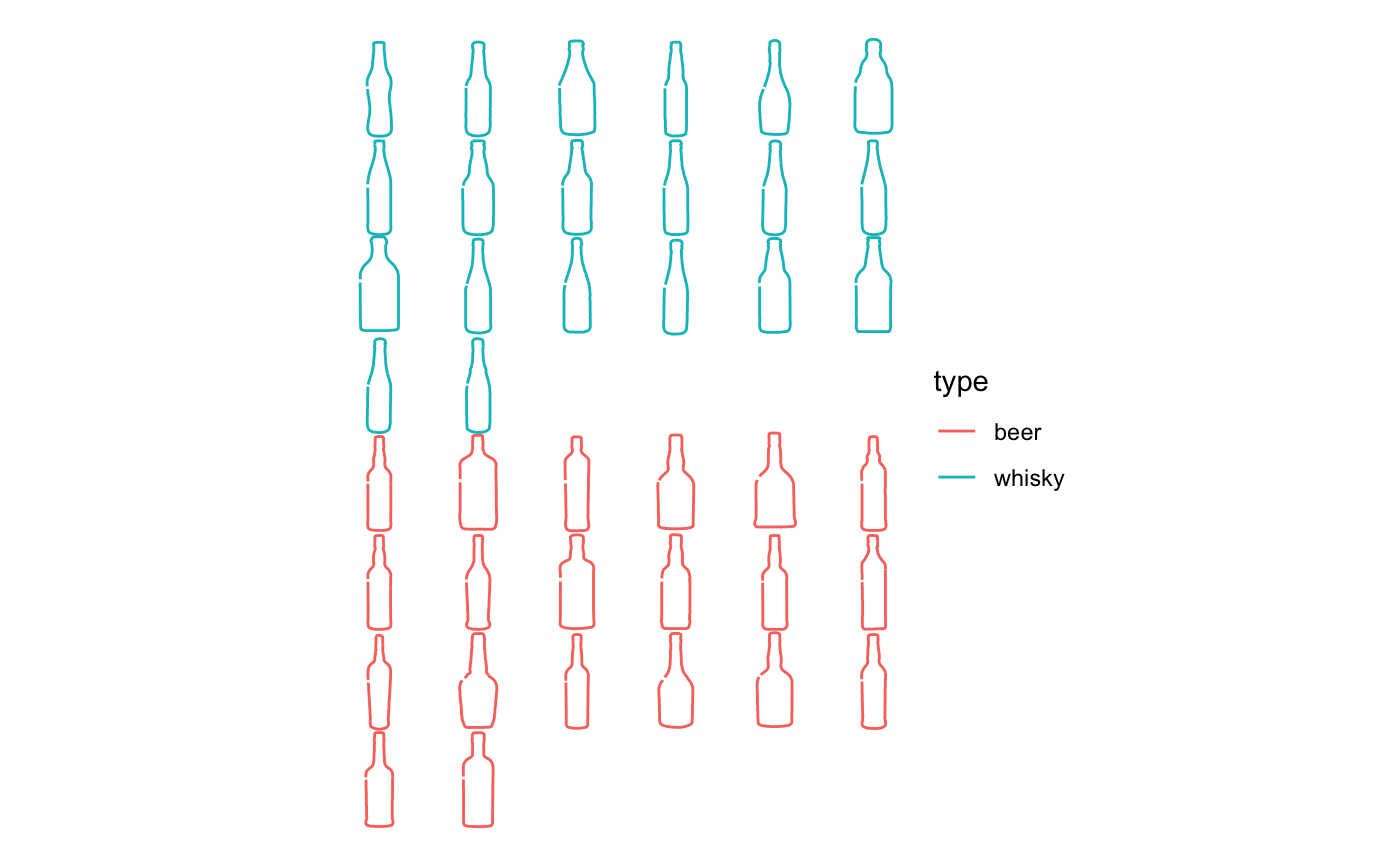
bot %>% mosaic(.label = type)
# With labels from tibble column
bot %>% mosaic(.label = type)
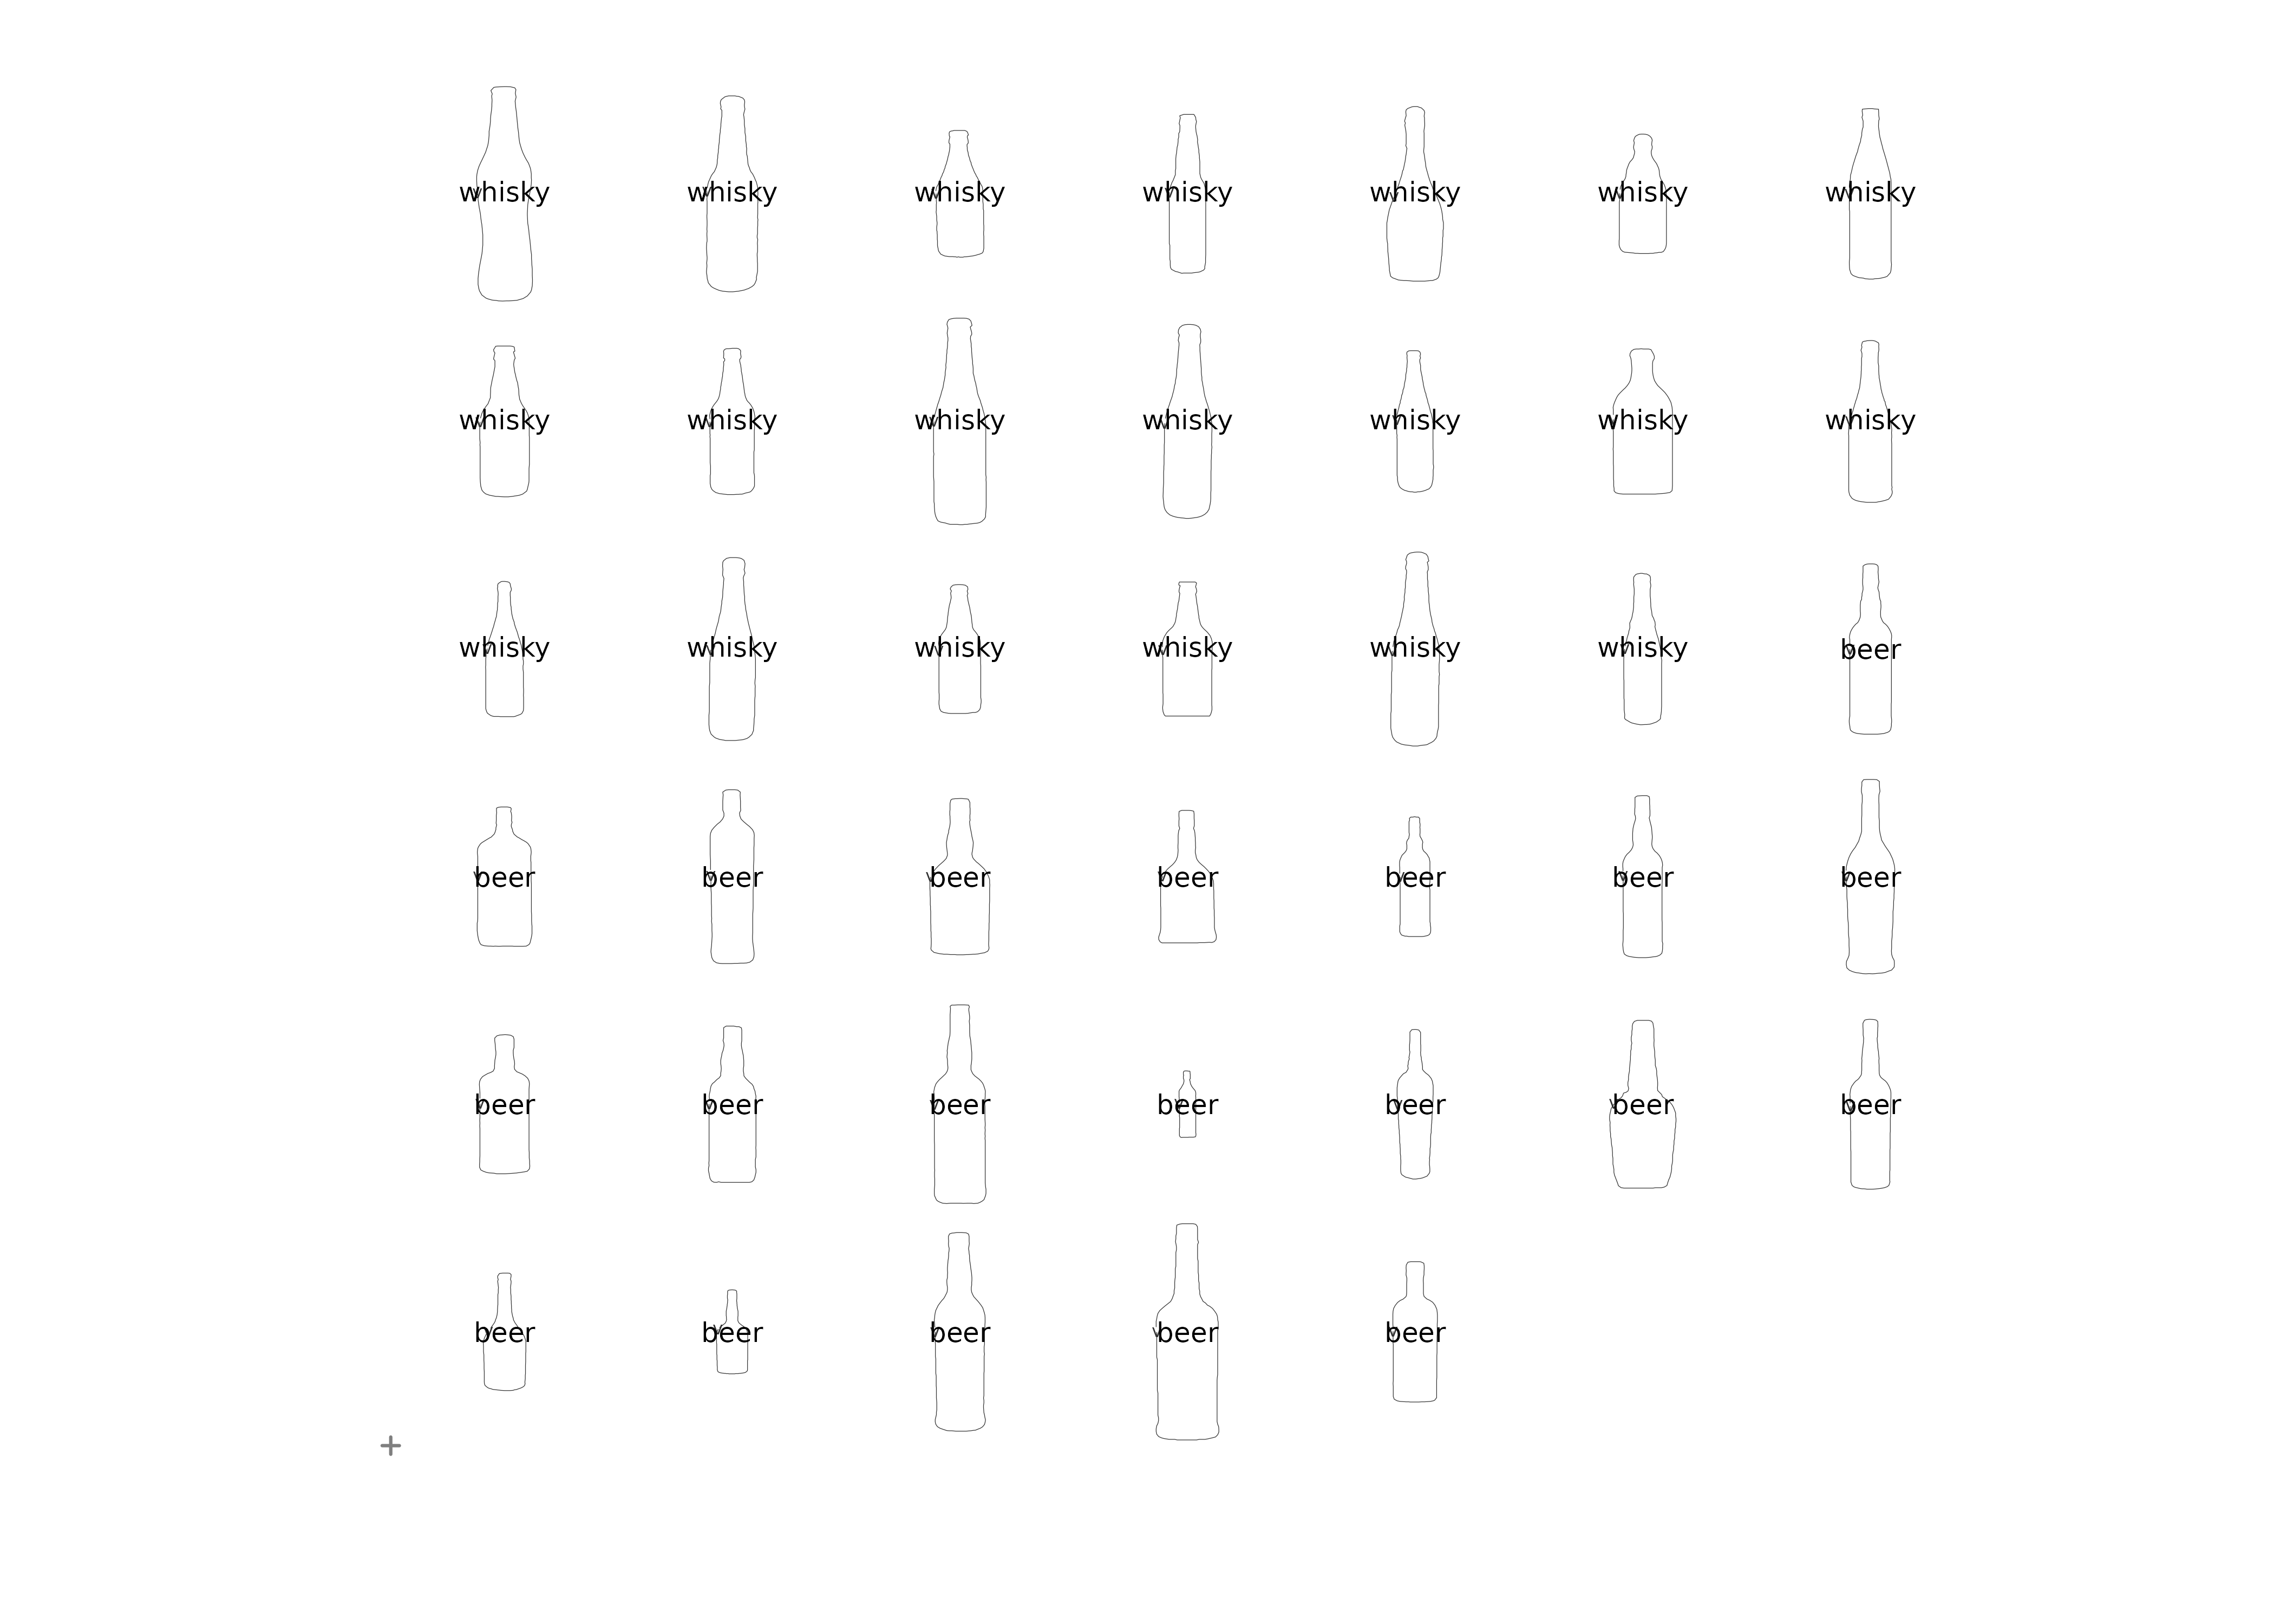 bot %>% mosaic(.label = "type", label_cex = 0.75)