efourier_shape calculates a 'Fourier elliptical shape' given Fourier
coefficients (see Details) or can generate some 'efourier' shapes.
Mainly intended to generate shapes and/or to understand how efourier works.
Arguments
- an
numeric. The \(a_n\) Fourier coefficients on which to calculate a shape.- bn
numeric. The \(b_n\) Fourier coefficients on which to calculate a shape.- cn
numeric. The \(c_n\) Fourier coefficients on which to calculate a shape.- dn
numeric. The \(d_n\) Fourier coefficients on which to calculate a shape.- nb.h
integer. The number of harmonics to use.- nb.pts
integer. The number of points to calculate.- alpha
numeric. The power coefficient associated with the (usually decreasing) amplitude of the Fourier coefficients (see Details).- plot
logical. Whether to plot or not the shape.
Details
efourier_shape can be used by specifying nb.h and
alpha. The coefficients are then sampled in an uniform distribution
\((-\pi ; \pi)\) and this amplitude is then divided by
\(harmonicrank^alpha\). If alpha is lower than 1, consecutive
coefficients will thus increase. See efourier for the mathematical
background.
References
Claude, J. (2008) Morphometrics with R, Use R! series, Springer 316 pp.
Ferson S, Rohlf FJ, Koehn RK. 1985. Measuring shape variation of two-dimensional outlines. Systematic Biology 34: 59-68.
See also
Other efourier:
efourier(),
efourier_i()
Examples
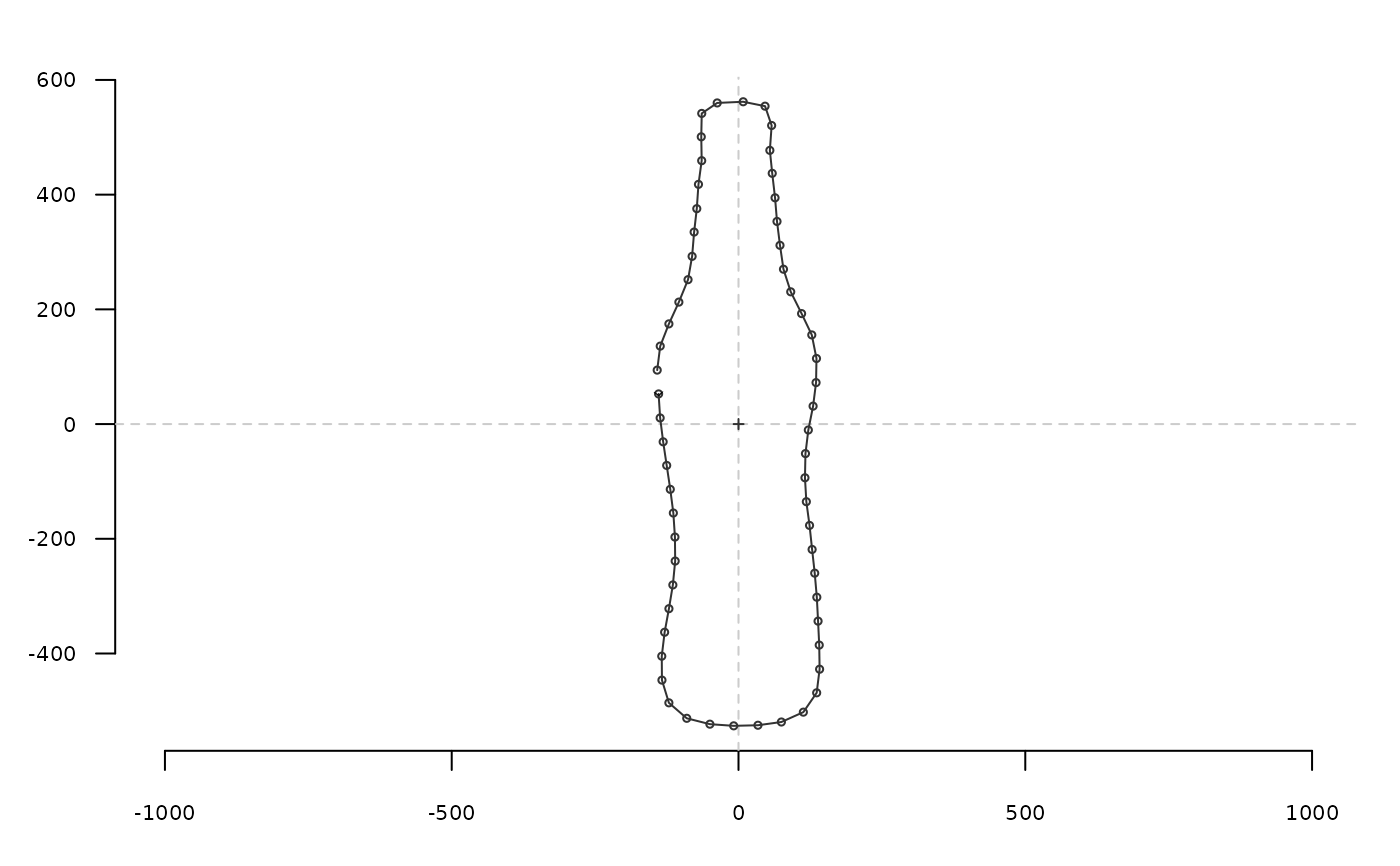
ef <- efourier(bot[1], 24)
efourier_shape(ef$an, ef$bn, ef$cn, ef$dn) # equivalent to efourier_i(ef)

#>                 x          y
#>  [1,] -139.292006   52.55414
#>  [2,] -136.616807   10.69211
#>  [3,] -131.350271  -30.94211
#>  [4,] -125.199336  -72.07640
#>  [5,] -118.953152 -113.78248
#>  [6,] -113.609682 -155.07182
#>  [7,] -110.814096 -196.99594
#>  [8,] -110.406802 -238.82588
#>  [9,] -114.448576 -280.46843
#> [10,] -121.291958 -321.87890
#> [11,] -128.793705 -362.93618
#> [12,] -133.799480 -404.68963
#> [13,] -133.459946 -446.39242
#> [14,] -121.381226 -485.99486
#> [15,]  -90.225043 -512.97786
#> [16,]  -49.878625 -523.21089
#> [17,]   -8.353210 -526.12066
#> [18,]   33.911396 -525.08469
#> [19,]   74.759609 -519.43972
#> [20,]  113.051448 -502.25491
#> [21,]  136.285584 -468.52283
#> [22,]  141.399365 -427.41134
#> [23,]  140.746409 -385.31652
#> [24,]  138.719031 -343.56495
#> [25,]  136.547192 -301.87577
#> [26,]  132.884166 -259.94004
#> [27,]  128.335128 -218.62173
#> [28,]  123.859620 -176.68909
#> [29,]  118.283114 -135.32263
#> [30,]  115.872309  -93.60856
#> [31,]  116.738256  -51.46991
#> [32,]  121.746650  -10.34707
#> [33,]  130.044438   31.28459
#> [34,]  135.215555   72.30011
#> [35,]  135.968480  114.36171
#> [36,]  127.773756  155.43284
#> [37,]  110.008193  192.61949
#> [38,]   91.059514  230.59227
#> [39,]   78.417823  270.00689
#> [40,]   72.336775  311.64758
#> [41,]   67.126887  353.28501
#> [42,]   63.718346  394.51271
#> [43,]   58.801472  437.18028
#> [44,]   54.675788  477.22927
#> [45,]   57.783825  520.56987
#> [46,]   46.279411  554.26720
#> [47,]    8.173233  561.94185
#> [48,]  -37.145543  559.89637
#> [49,]  -64.096831  541.62656
#> [50,]  -64.927840  500.81669
#> [51,]  -64.170645  459.21723
#> [52,]  -69.796352  417.94924
#> [53,]  -72.732679  375.54798
#> [54,]  -77.369097  334.76587
#> [55,]  -80.882096  292.41632
#> [56,]  -87.983533  251.76743
#> [57,] -103.969321  212.65038
#> [58,] -121.348549  174.68203
#> [59,] -136.478064  135.92288
#> [60,] -141.748300   94.09730
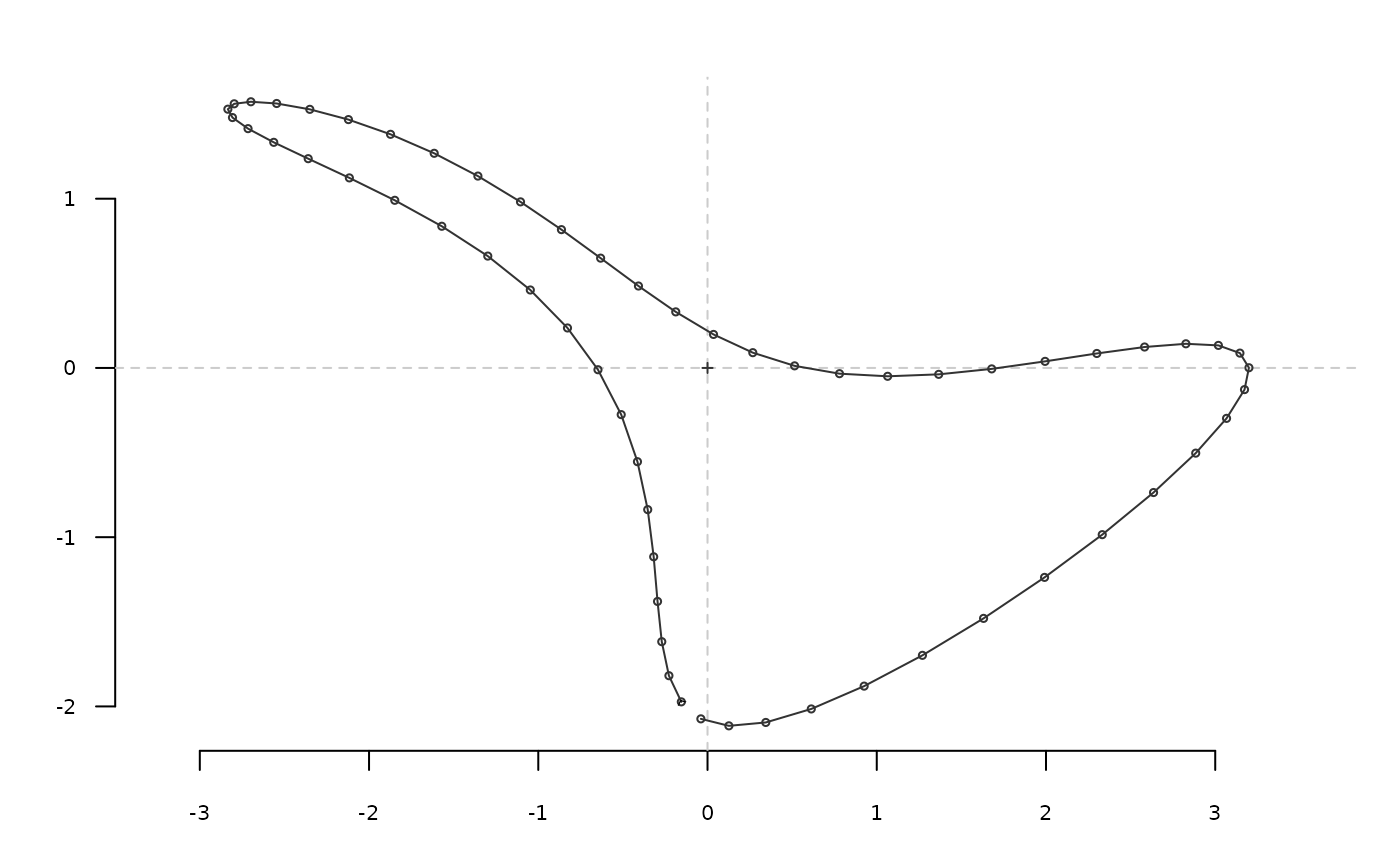
efourier_shape() # is autonomous

#>                  x            y
#>  [1,]  0.956635276  0.324221806
#>  [2,]  0.754257770  0.310009047
#>  [3,]  0.524857878  0.330874830
#>  [4,]  0.284551667  0.383617374
#>  [5,]  0.049705772  0.461837462
#>  [6,] -0.164272930  0.556287050
#>  [7,] -0.344046410  0.655485951
#>  [8,] -0.479262946  0.746562767
#>  [9,] -0.563210732  0.816254299
#> [10,] -0.593159838  0.851981336
#> [11,] -0.570373139  0.842909784
#> [12,] -0.499796549  0.780905309
#> [13,] -0.389467016  0.661297359
#> [14,] -0.249700853  0.483383847
#> [15,] -0.092142655  0.250629652
#> [16,]  0.071235055 -0.029461652
#> [17,]  0.229090199 -0.345795131
#> [18,]  0.371543737 -0.684415478
#> [19,]  0.490817928 -1.029461687
#> [20,]  0.581633089 -1.364266317
#> [21,]  0.641340991 -1.672508231
#> [22,]  0.669799718 -1.939323963
#> [23,]  0.669020278 -2.152287610
#> [24,]  0.642636889 -2.302181986
#> [25,]  0.595268695 -2.383503317
#> [26,]  0.531849131 -2.394666233
#> [27,]  0.456999556 -2.337902860
#> [28,]  0.374516159 -2.218876818
#> [29,]  0.287024437 -2.046057479
#> [30,]  0.195835358 -1.829919597
#> [31,]  0.101013674 -1.582046590
#> [32,]  0.001644457 -1.314221328
#> [33,] -0.103738929 -1.037585715
#> [34,] -0.216620915 -0.761940204
#> [35,] -0.337932116 -0.495237715
#> [36,] -0.467513637 -0.243304975
#> [37,] -0.603688275 -0.009800365
#> [38,] -0.742999303  0.203606770
#> [39,] -0.880160355  0.396872222
#> [40,] -1.008237846  0.571082718
#> [41,] -1.119062378  0.727897076
#> [42,] -1.203840363  0.868992559
#> [43,] -1.253914181  0.995583063
#> [44,] -1.261600987  1.108065504
#> [45,] -1.221028684  1.205834655
#> [46,] -1.128884005  1.287286435
#> [47,] -0.984992425  1.350007413
#> [48,] -0.792662685  1.391126362
#> [49,] -0.558748679  1.407784517
#> [50,] -0.293406744  1.397666570
#> [51,] -0.009554424  1.359526156
#> [52,]  0.277934967  1.293638377
#> [53,]  0.553241971  1.202118073
#> [54,]  0.800734198  1.089055466
#> [55,]  1.006128989  0.960439263
#> [56,]  1.157586386  0.823859373
#> [57,]  1.246637355  0.688004993
#> [58,]  1.268865039  0.561996396
#> [59,]  1.224277402  0.454608128
#> [60,]  1.117335981  0.373455290

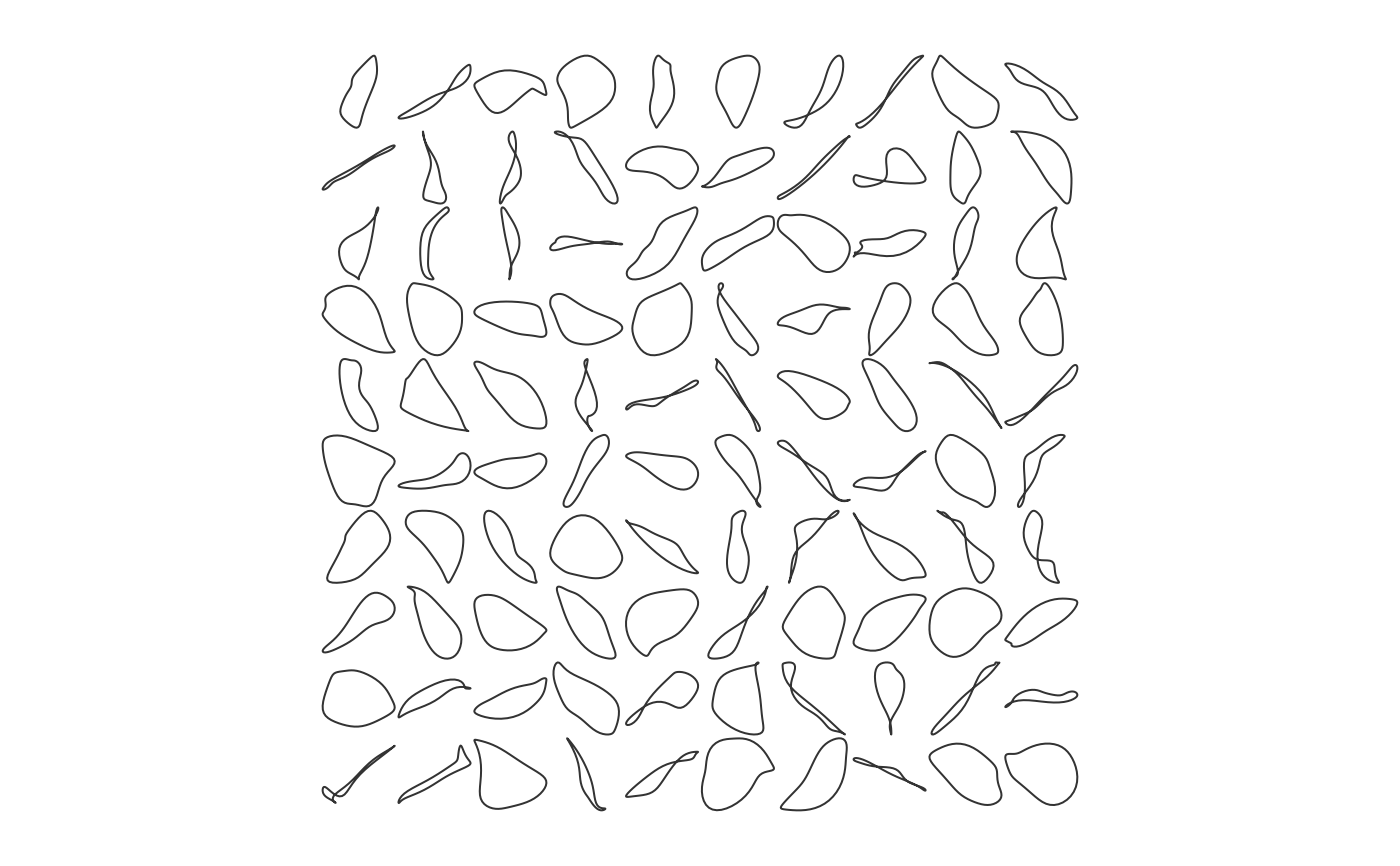
panel(Out(a2l(replicate(100,
efourier_shape(nb.h=6, alpha=2.5, plot=FALSE))))) # Bubble family

