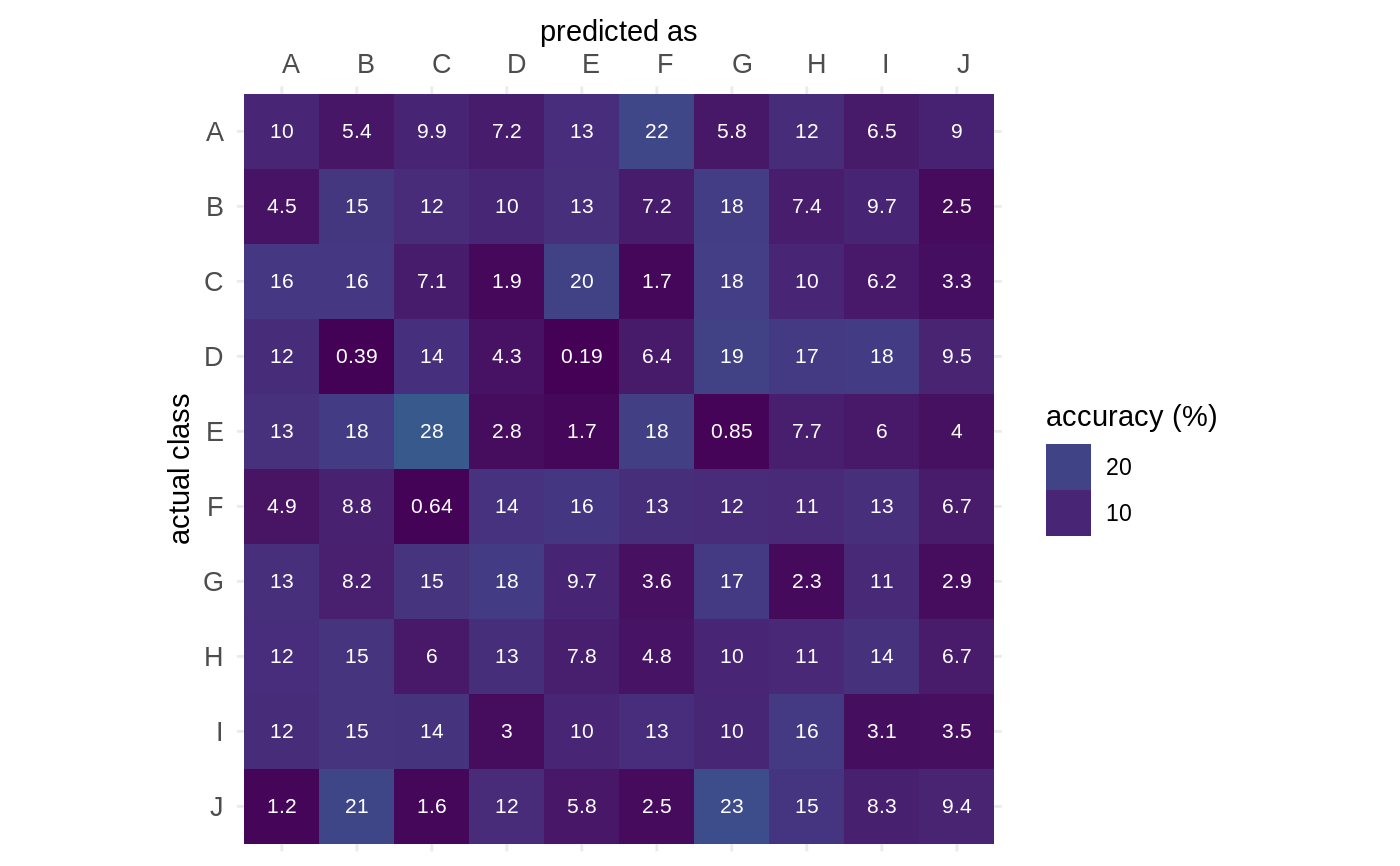
Plot confusion matrices
gg_CV.RdPlots as heatmap and with useful cosmetics
gg_CV(
  x,
  prop = TRUE,
  percent = TRUE,
  drop_zeros = TRUE,
  text = TRUE,
  text_colour = "white",
  text_size = 8,
  text_signif = 2,
  axis_size = 10,
  axis_x_angle = 0
)

# S3 method for default
gg_CV(
  x,
  prop = TRUE,
  percent = TRUE,
  drop_zeros = TRUE,
  text = TRUE,
  text_colour = "white",
  text_size = 8,
  text_signif = 2,
  axis_size = 10,
  axis_x_angle = 0
)

# S3 method for stat_lda_full
gg_CV(
  x,
  prop = TRUE,
  percent = TRUE,
  drop_zeros = TRUE,
  text = TRUE,
  text_colour = "white",
  text_size = 8,
  text_signif = 2,
  axis_size = 10,
  axis_x_angle = 0
)

# S3 method for matrix
gg_CV(
  x,
  prop = TRUE,
  percent = TRUE,
  drop_zeros = TRUE,
  text = TRUE,
  text_colour = "white",
  text_size = 8,
  text_signif = 2,
  axis_size = 10,
  axis_x_angle = 0
)
Arguments
| x | confusion matrix or |
|---|---|
| prop |
|
| percent |
|
| drop_zeros |
|
| text |
|
| text_colour |
|
| text_size |
|
| text_signif |
|
| axis_size |
|
| axis_x_angle |
|
Details
when a matrix is passed, it assumes that it is:
squared
rows are for actual classes
columns for predicted classes
class accuracies are calculated per actual classes, ie rowwise
Examples
# works fine on matrices too
# set.seed(2329) # for the sake of replicability
m <- matrix(sample(1:100), 10)
gg_CV(m)#> # A tibble: 100 x 8
#>    actual predicted     n  prop n_class prop_class n_total label
#>    <chr>  <chr>     <int> <dbl>   <int>      <dbl>   <int> <dbl>
#>  1 A      A            45 10.1      446     0.0883    5050  10
#>  2 B      A            23  4.47     514     0.102     5050   4.5
#>  3 C      A            76 15.8      480     0.0950    5050  16
#>  4 D      A            63 12.3      514     0.102     5050  12
#>  5 E      A            47 13.4      352     0.0697    5050  13
#>  6 F      A            31  4.94     627     0.124     5050   4.9
#>  7 G      A            68 13.0      525     0.104     5050  13
#>  8 H      A            73 12.5      586     0.116     5050  12
#>  9 I      A            69 12.1      572     0.113     5050  12
#> 10 J      A             5  1.15     434     0.0859    5050   1.2
#> # … with 90 more rows
