To ease transparency handling.
Examples
x <- col_transp(10, col='#000000')
x
#> [1] "#000000f0" "#0000001c" "#00000038" "#00000055" "#00000071" "#0000008d"
#> [7] "#000000aa" "#000000c6" "#000000e2" "#000000ff"
barplot(1:10, col=x, main='a transparent black is grey')
 summer10 <- col_summer(10)
summer10
#> [1] "#4876FF" "#7094C6" "#99B28D" "#C2D155" "#EAEF1C" "#FFE805" "#FFBA0F"
#> [8] "#FF8C1A" "#FF5E25" "#FF3030"
summer10.transp8 <- col_alpha(summer10, 0.8)
summer10.transp8
#> [1] "#4876FF32" "#7094C632" "#99B28D32" "#C2D15532" "#EAEF1C32" "#FFE80532"
#> [7] "#FFBA0F32" "#FF8C1A32" "#FF5E2532" "#FF303032"
summer10.transp2 <- col_alpha(summer10, 0.8)
summer10.transp2
#> [1] "#4876FF32" "#7094C632" "#99B28D32" "#C2D15532" "#EAEF1C32" "#FFE80532"
#> [7] "#FFBA0F32" "#FF8C1A32" "#FF5E2532" "#FF303032"
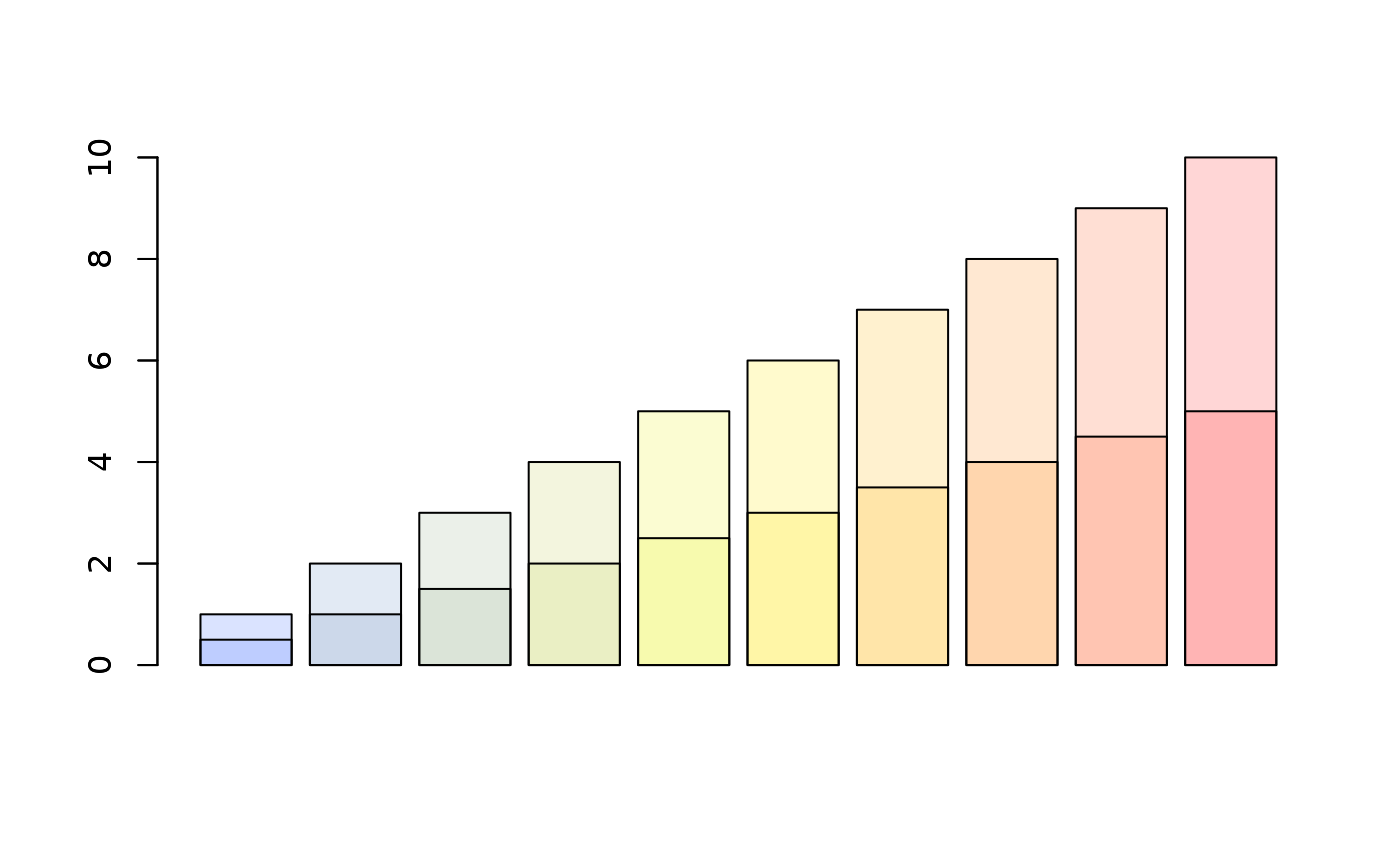
x <- 1:10
barplot(x, col=summer10.transp8)
barplot(x/2, col=summer10.transp2, add=TRUE)
summer10 <- col_summer(10)
summer10
#> [1] "#4876FF" "#7094C6" "#99B28D" "#C2D155" "#EAEF1C" "#FFE805" "#FFBA0F"
#> [8] "#FF8C1A" "#FF5E25" "#FF3030"
summer10.transp8 <- col_alpha(summer10, 0.8)
summer10.transp8
#> [1] "#4876FF32" "#7094C632" "#99B28D32" "#C2D15532" "#EAEF1C32" "#FFE80532"
#> [7] "#FFBA0F32" "#FF8C1A32" "#FF5E2532" "#FF303032"
summer10.transp2 <- col_alpha(summer10, 0.8)
summer10.transp2
#> [1] "#4876FF32" "#7094C632" "#99B28D32" "#C2D15532" "#EAEF1C32" "#FFE80532"
#> [7] "#FFBA0F32" "#FF8C1A32" "#FF5E2532" "#FF303032"
x <- 1:10
barplot(x, col=summer10.transp8)
barplot(x/2, col=summer10.transp2, add=TRUE)